From: Nick Dahir and Alex Laurin
To: Canadian Policy Watchers
Date: January 14, 2022
Re: The Net Cost of Pandemic Emergency/Recovery Benefits
Statistics Canada’s updated version of its Social Policy Simulation Database and Model (SPSD/M) integrates all of the extraordinary provincial and federal COVID-related cash benefits delivered in 2020. Giving us, for the first time, the opportunity to analyze their distributional incidence and the impact of income taxes paid on the payments. The list is long, but by far the largest in value delivered directly to individuals were the emergency/recovery benefits paid out to help families cope with their loss of employment income due to lockdowns, sickness, or to care for relatives with COVID – i.e. the CERB, the CESB, the CRB, the CRSB, and the CRCB.
Using the SPSD/M, we’ve performed multiple simulations allowing us to answer a few interesting questions:
How were COVID emergency/recovery benefits distributed among families based on their 2019 pre-pandemic income levels?
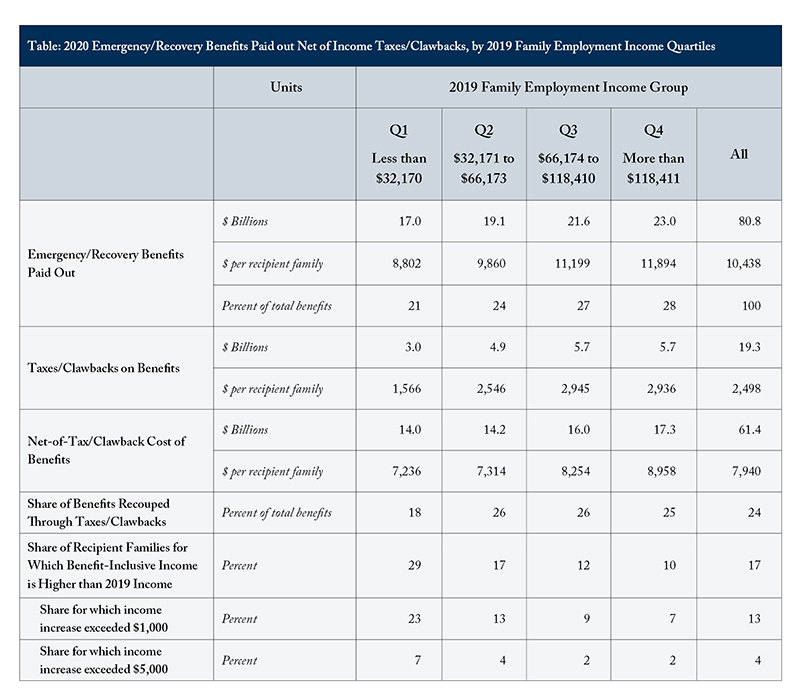
It is interesting to see how the over $80 billion of emergency/recovery benefits were distributed based on pre-pandemic family income, given that they were created to compensate for a COVID-related loss of income. Table 1 shows the amount of benefits received by 2019 employment income quartiles. The bottom quartile of pre-pandemic family income – families with employment incomes less than $32,170 – received about a fifth of all benefits or less than $9,000 per family. The share and amounts of benefits received increase with family income, with the top quartile receiving the largest average amount per family at a little less than $12,000.
Since COVID emergency/recovery benefits were taxable, how much of the payouts did governments recuperate in income taxes and clawbacks of next year’s income-tested cash transfer entitlements?
Federal and provincial income taxes paid on COVID benefits and clawbacks of next year’s income-tested cash transfer entitlements – i.e. transfer (or benefit) programs such as the Canada Child Benefit, the GST Tax Credit, and similar income-tested provincial cash benefits – allowed Canadian governments to recoup a portion of the cost of COVID-related payouts. Overall, families repaid 24 percent of COVID emergency/recovery benefits through taxes and clawbacks, with bottom-quartile earners repaying less (Table 1).
Did COVID emergency/recovery benefits push 2020 family incomes above their 2019 levels?
We often heard that for some families, income from COVID emergency/recovery benefits in 2020 actually exceeded their true loss of employment income. We do not know what would have been a family’s income without COVID, but we can roughly guess by presupposing that family employment income losses are equal to the difference between their 2020 and 2019 incomes. For families with lower employment income in 2020 than in 2019, the portion of COVID benefits pushing their 2020 income to exceed their 2019 level would constitute an increase in income. By the same logic, for families with higher employment income in 2020 than in 2019, the entire amount of COVID benefits would contribute to the income increase. Overall, the vast majority of COVID emergency/recovery benefit recipient families ended 2020 with benefit-inclusive incomes lower than their pre-pandemic 2019 employment incomes. Overall, only about 17 percent of recipient families ended 2020 with benefit-inclusive incomes higher than their pre-pandemic 2019 employment incomes – many of which from the lower income group. The share of families for which their income increase exceeds $1,000 is slightly lower, at 13 percent, while very few families had income increases exceeding $5,000 (Table 1).
Nick Dahir is a Research Assistant and Alex Laurin is Director of Research at the C.D. Howe Institute.
To send a comment or leave feedback, email us at blog@cdhowe.org.
The views expressed here are those of the authors. The C.D. Howe Institute does not take corporate positions on policy matters.