






The Study In Brief
Recent figures on Canada’s stock of capital and new business investment are worrying. Canada’s capital stock is not keeping pace with its workforce. New business investment per worker is declining. Not only have areas of traditional strength in Canadian business investment – non-residential and engineering structures – fallen in recent years, but the categories most associated with innovation and future productivity – machinery and equipment (M&E) and intellectual property (IP) products – are weaker yet.
After improving against international competitors during the 2000s and early in the 2010s, business investment per available worker in Canada slipped badly after 2014 and appears to have dropped further during the pandemic. This weakness is both a likely effect of weak productivity growth in the present and a harbinger of weak productivity growth in the future. It means that Canadian workers will have less capital – less nonresidential building and engineering, less M&E and less in the way of IP products – with which to produce goods and services, earn incomes and fund public services in the years to come.
Public policy can and should help. Measures to boost business’s desire to invest, such as productivity-enhancing competition, and measures that increase the supply of investment capital, such as tax reforms, can help Canadian workers get more of the tools that will raise their future incomes and living standards.
Private-sector investment in non-residential buildings, engineering infrastructure, machinery and equipment, and intellectual-property products is at the core of economic growth.1The idea that capital accumulation is a key driver of economic growth goes back centuries. A key contribution to modelling it formally, showing how a rising stock of capital expands output and output per worker, is Solow (1956). Sala-i-Martin (1997) and Caselli and Feyrer (2007) provide key investigations of the correlation between growth and investment at the national level.
It is a key indicator of businesses’ views about prospects for productivity improvements. It boosts activity as it occurs and, once in place, equips workers to raise their output and incomes. The buildings where people work, the infrastructure that moves products and services, the tools workers use on the job and the intellectual property that drives innovation and productivity all raise living standards over time. And all matter for the robust, sustained expansion Canadians hope for as we emerge from the COVID-19 pandemic.
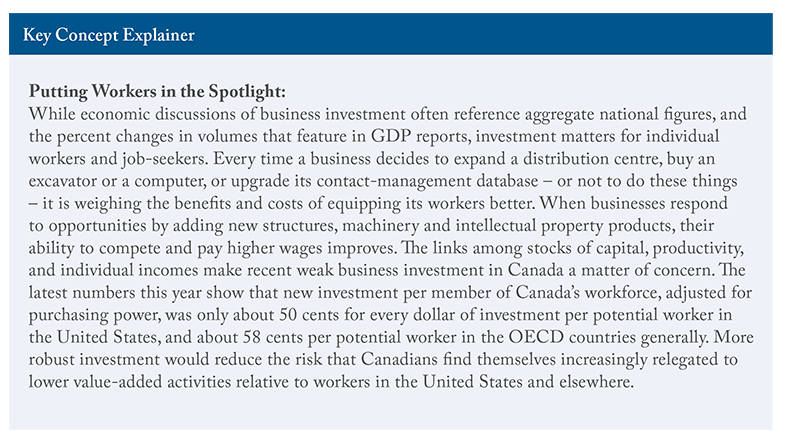
For these reasons, recent figures on Canada’s stock of capital and new investment are worrying. Canada’s capital stock is not keeping pace with its workforce. New business investment per worker is declining. Not only have areas of traditional strength in Canadian business investment – non-residential and engineering structures – fallen in recent years, but the categories most associated with innovation and future productivity – machinery and equipment (M&E) and intellectual property (IP) products – are weaker yet.
While benign explanations exist for Canada’s lower business-investment rates, notably a shift toward less capital-intensive sectors or activities generally, the United States and other countries in the Organisation for Economic Co-operation and Development (OECD) are nevertheless investing at higher rates. Business investment per available Canadian worker was approaching comparable US and OECD measures from the early 2000s to the mid-2010s. But it sagged after mid-decade and seems to be particularly weak since the COVID pandemic began.
To the extent that Canada’s weak performance reflects perceptions of limited opportunities or little need for higher investment by business leaders, public policy can and should help. Measures to boost business’s desire to invest, such as productivity-enhancing competition, and measures that increase the supply of investment capital, such as tax reforms, can help Canadian workers get more of the tools that will raise their future incomes and living standards.
The Numbers
The capital they use on the job is critical to workers’ ability to produce goods and services, earn incomes and compete internationally. Human capital and natural capital are intuitively important, but we do not yet have good measures of either and, therefore, cannot compare them internationally. Capital created and owned by governments also matters, but the services it yields are harder to relate to production and income and also too hard to compare internationally.
We do have relatively robust measures of built capital in the business sector: non-residential buildings and engineering structures; M&E, and IP products. These complement human and natural capital, and government infrastructure, in producing goods and services and generating incomes. For a snapshot of the correlations between capital stock on one hand and incomes and output on the other, consider Figure 1, which compares 2021 OECD estimates for both, divided by the labour force in each country.
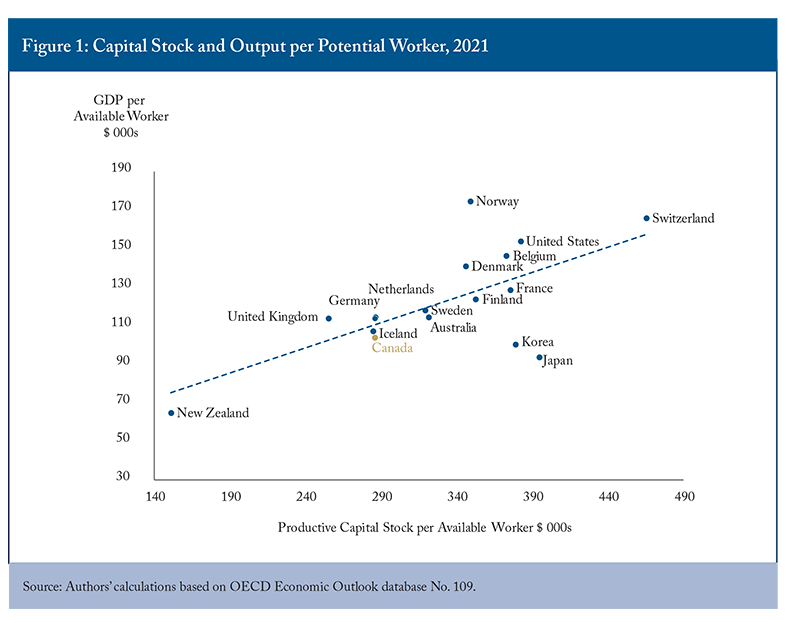
Figure 1 highlights per-worker measures – labour productivity rather than total, or multifactor, productivity – and capital stock rather than output per unit of capital and labour considered together.2We divide capital stock by labour force to provide per-available-worker measures for several reasons. First, it highlights the links among capital, productivity, and incomes at the level of individual workers. Second, it seems a reasonable compromise among alternatives, such as capital per person of labour-force age, or capital per employed person, when making comparisons over time and across countries. Among other considerations, labour-force participation varies with the economic cycle, as does business investment, but is less volatile than employment, yielding measures less subject to violent short-term swings (an especially important consideration during the COVID pandemic). We use the total labour force because capital invested by business generates the incomes that support both private-sector and public-sector workers, and because it facilitates international comparisons as different jurisdictions classify private- and public-sector workers differently. Ideally, we would attribute output to quantities and qualities of labour and capital, as well as other factors, such as organization of firms, and be able to explain changes in output with reference to changes in the various inputs. Definitive attributions of that kind are out of reach at present, however, especially in making international comparisons. What is evident is that countries with high labour productivity are also countries with high total productivity. That makes sense: the correlation between capital stock and incomes is a consequence of complementary forces. Higher productivity creates opportunities, and competitive threats, for businesses, which incent investment, increasing the quantity and quality of the capital stock. And more and better capital investment raises productivity, a virtuous circle for workers who enjoy higher incomes as a result.
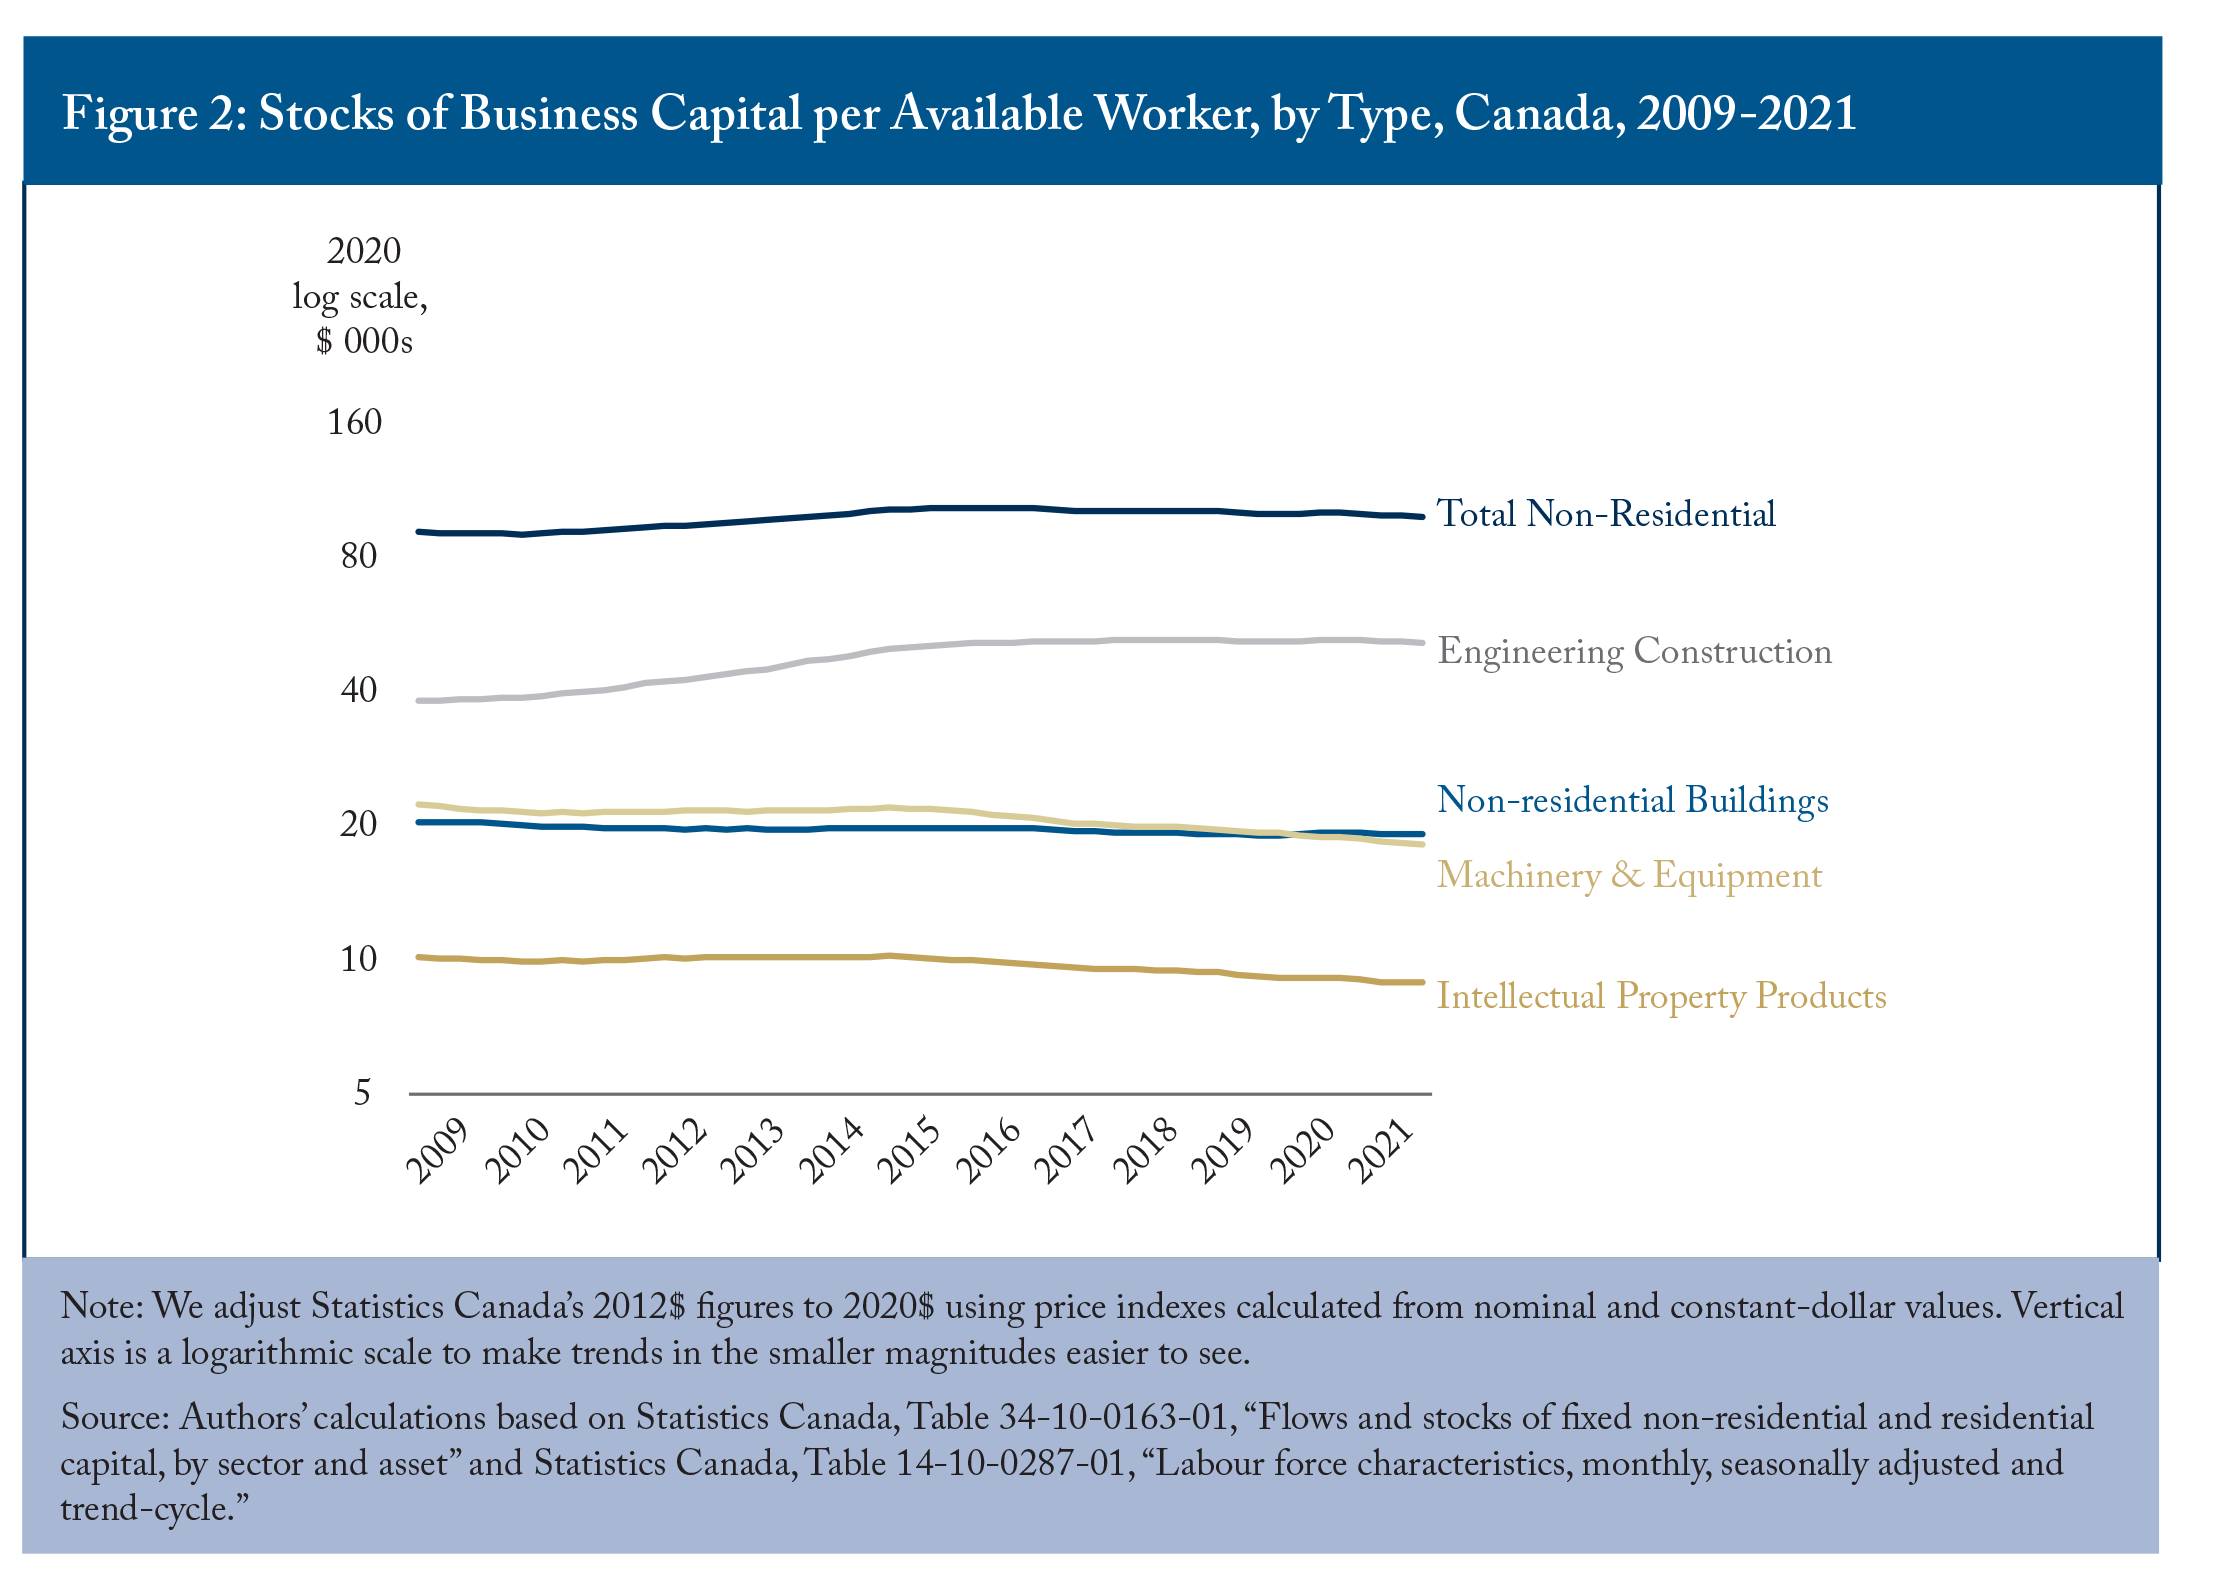
The fact that capital formation is both a consequence of productivity growth, which spurs it, and a driver of productivity growth makes recent trends in Canada – summarized in Figure 2, which shows real stocks of each type of capital per available worker – troubling.
Engineering construction was the only type of business capital that grew faster than the labour force from 2009 until mid-decade, while other types simply kept pace. From 2015 until the end of 2020, engineering construction grew at about the same rate as the labour force, while other types of capital grew more slowly. Past research has identified M&E investment as particularly important for productivity growth (Sala-i-Martin 2001, Rao et al. 2003, Stewart and Atkinson 2013). Meanwhile, recent opportunities and competitive pressures make IP-products investment a plausible bellwether for how businesses see Canada’s likely performance in a world where intangible capital is increasingly important (Marple 2021).3In the Canadian income and expenditure accounts, IP products consist of three major sub-components: mineral exploration and evaluation, research and development, and software. In many countries, IP products also include entertainment, literary or artistic originals, and databases, but the Canadian accounts do not include the former because of data limitations and do not include the latter because they are not yet big enough to matter (Statistics Canada 2016). Therefore, less of these types of capital per worker may be a particular concern. Whatever the significance of each component since 2020, the stock of every type of business capital per available worker in Canada is down.
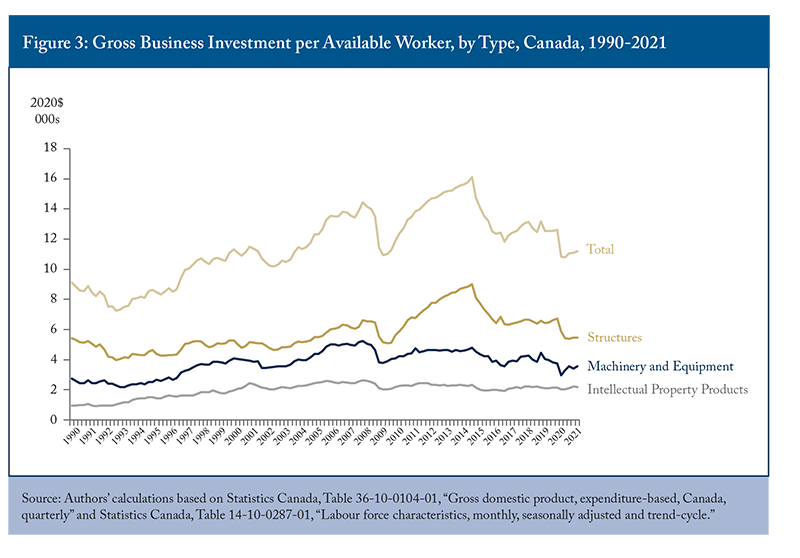
It would be informative to compare these capital-stock figures over longer periods and against similar figures abroad, but they exist in Canada only since 2009 and are not available for many other countries. However, comparisons over longer periods and with other countries are possible when considering a closely related flow measure: gross business investment. Figure 3 shows the Canadian numbers for the three types of this investment tracked by Statistics Canada and most other national statistical agencies: non-residential structures (both buildings and engineering), M&E and IP products since 1990.
Absent any changes in estimated depreciation and write-offs for existing capital, changes in gross investment should match the inflections in the net capital-stock figures. As the net stock figures would lead us to expect, the gross investment figures show relative strength in non-residential structures before mid-decade along with weaker performance in M&E and IP products. However, per-available-worker investment in structures and M&E declined between mid-decade and last year while that in IP products held steady. Since last year, these measures have rebounded slightly. Summing across the three types, per-available-worker investment in real terms in Canada in the second quarter of 2021 was about $11,200, down from a peak of $15,800 in 2014 and barely above their trough in the financial crisis and recession of 2008-2009.
Canada’s Performance against Competitors Abroad
The growing importance of intangible assets, and an overall decline in the materials intensity of economic activity more generally, might help explain declining capital investment and reassure us that it does not prefigure slower income growth. These trends affect many countries, so we look now to see how Canada’s experience compares with that of the United States and other OECD countries. Is capital investment trending similarly elsewhere, or does Canada appear to be on a path toward relatively higher capital intensity, implying higher productivity and higher wages, or toward relatively lower capital intensity, raising concerns about lower productivity and lower wages?
Canada versus the United States
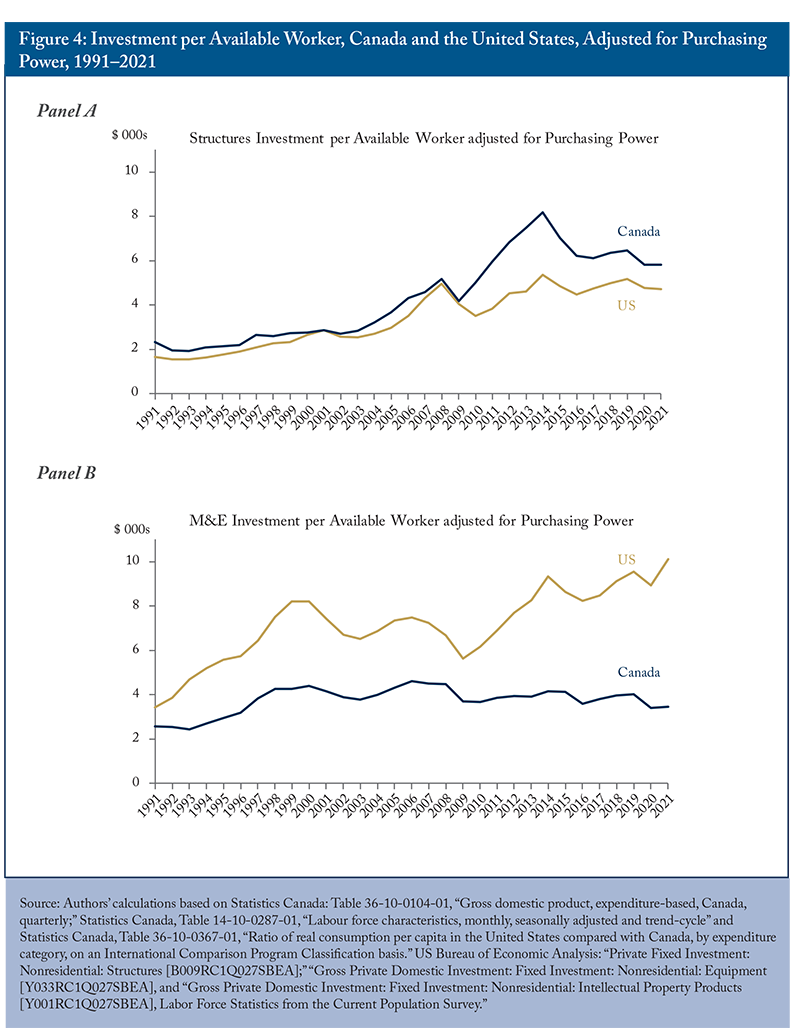
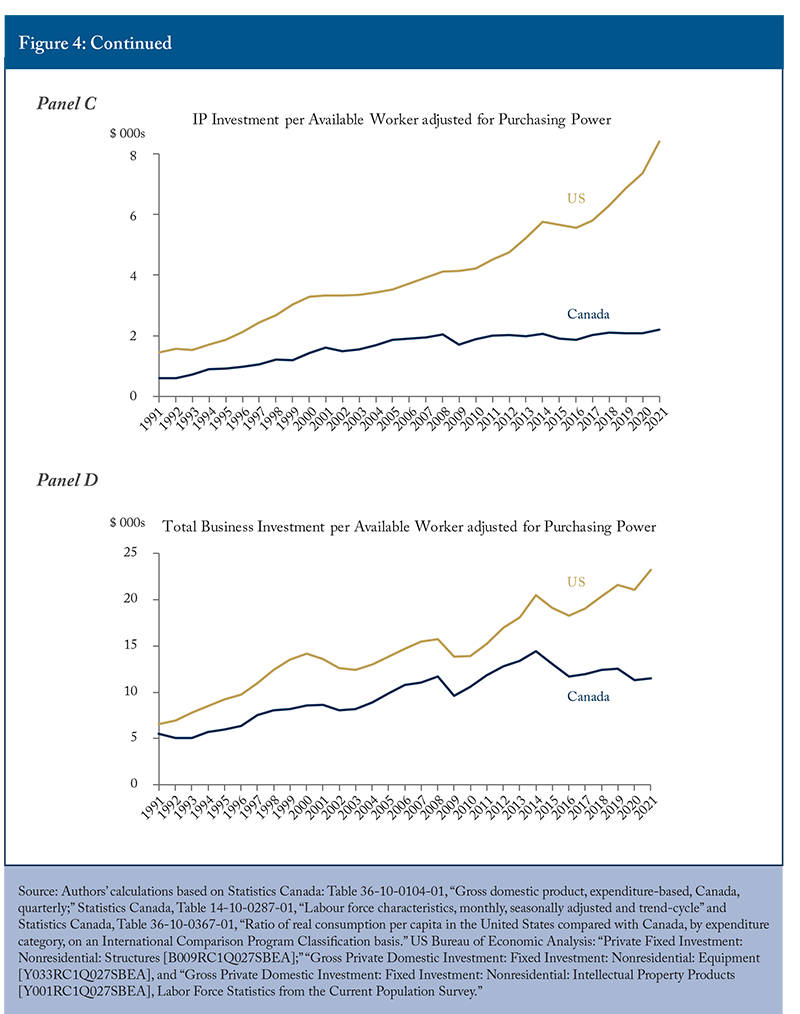
Because Canada and the United States collect similar capital investment data, and because Statistics Canada takes particular care to compare Canadian to US prices, we can measure investment per available worker in the two countries with relatively high confidence, as shown in Figure 4, panels A through D. Here, we convert the different types of capital investment into Canadian dollars using Statistics Canada’s measures of relative capital-equipment price levels to adjust for purchasing-power differences in the two countries.4The comparative purchasing-power ratios in construction, M&E and IP products in 2021 are 82 percent, 85 percent and 96 percent, respectively. Investment goods tend to be less expensive overall in the United States than in Canada, so using the exchange rate alone in converting US to Canadian dollars would understate the return US companies get per investment dollar. Our adjustment provides a better idea of how much bang businesses get per buck spent on structures, M&E or IP products on either side of the border.
Canada has an edge in investment in structures (panel A of Figure 4) because Canadian businesses, with their relatively greater focus on natural resources, have tended to invest more per worker in this area. However, the difference shrank after the middle 2010s as Canada’s per-available-worker structures investment stagnated, while the counterpart US measure rebounded.
The comparison in M&E investment (panel B) is much less favourable to Canada. US businesses typically spend more per available worker on such investment, and the gap has widened over the past decade. The gap in the second quarter of 2021 was $6,600.
The IP products gap (panel C) is worse yet. Since the mid-2000s, Canadian businesses’ spending on these products has in a narrow range around $2,000 per available worker, while the US figure has risen from some $3,000 to more than $8,000. Some of this difference reflects slumping mineral exploration expenditures in Canada, where the resources sector has struggled. To the extent this growing gap reflects greater use by Canadian businesses of information technology owned by foreign firms, its implications for productivity are ambiguous: that reliance might be simply a smart business decision on the Canadian side, or it might reflect Canada’s lack of competitiveness in commercializing its own IP, leading to lower accumulation of it by domestic firms.
Looking at the three types of investment together (panel D), we see that business investment per available US worker exceeded that in Canada by a widening margin through the 1990s. The gap narrowed in the 2000s but widened markedly after the mid-2010s and has widened further during the pandemic. The gap between gross investment per potential US worker and the equivalent Canadian figure in the second quarter of 2021 was $11,700. That is a lot of money – it represents a significant shortening of the replacement and upgrade cycle for a piece of capital equipment such as a truck or an excavator, a major upgrade of health and safety in a workplace, or a complete replacement of many office workers’ entire information and communications technology.
Asking how many cents of new investment per available Canadian worker occurs for every dollar of new investment per available US worker yields a summary comparative measure. In Figure 5, we show our measure of investment in Canada per dollar of its US equivalent in total and in each investment category.
Canada’s relatively robust rate of structures investment stands out in this figure. The surge to the 2013 peak – when each available Canadian worker was getting more than $1.60 for every dollar of new structures enjoyed by her or his US counterpart – is striking. So is the subsequent decline to less than $1.25 more recently.
For every dollar of new M&E per available US worker, Canadians improved from fewer than 60 cents around the turn of the century to close to 70 cents around the time of the 2008–2009 financial crisis and slump. However, Canada’s relative rate of M&E investment has dropped since then to a dismal 34 cents.
The situation with IP products is even worse, with a steadily declining trend since the mid-2000s to the point where the average Canadian available worker in the second quarter of 2021 enjoyed only 26 cents of new investment in IP products for every dollar enjoyed by the average US available worker.
Add the three types of capital together, and new investment per available worker in Canada, adjusted for purchasing power, was only about 50 cents for every dollar of investment per available US worker in the second quarter of 2021 – lower than at any point since the beginning of the 1990s. Many observers identify investment in M&E and IP products as creating spillovers that may be particularly important for productivity and economic growth, which would make the composition of Canadian investment even more troubling.5On M&E investment’s potential importance for growth, see Sala-i-Martin (2001) and Rao, Tang and Wang (2003). Some useful recent references to IP products investment are Stewart and Atkinson (2013) and Marple (2021). Simply read as evidence of businesses’ judgements about the attractiveness of capital investment in Canada versus the United States, these contrasts are troubling. Their implications for the future incomes of employees on the northern side of the border are ominous.
Canada versus the United States: Energy and Non-Energy Investment
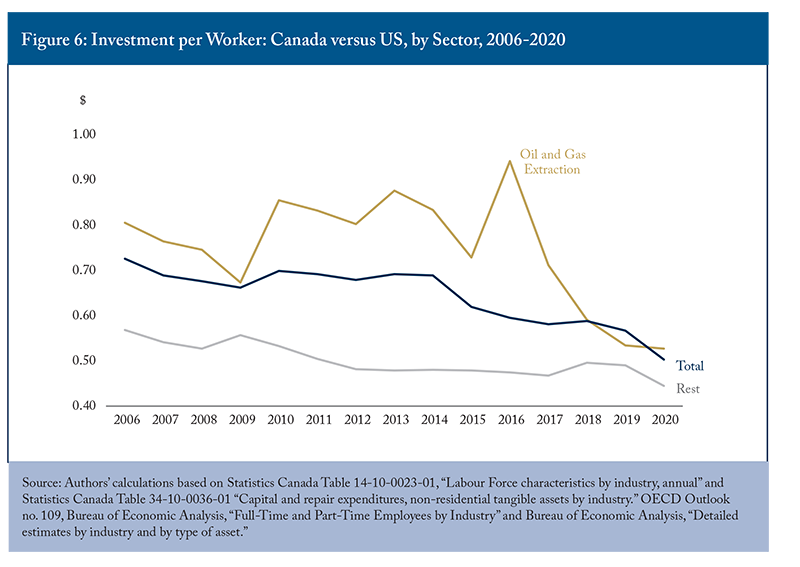
Energy production is relatively capital intensive and important to the Canadian economy, so it is natural to wonder if the energy sector – which thrived until 2014 and has struggled since 2015 – is critical in Canada’s relative investment performance. For those who see fossil fuels as a sunset industry, declines in capital per available energy worker that reflect a shift away from an activity with bleak prospects would be less troubling. As with the comparisons above, we can take advantage of relatively comparable Canadian and US data to see what has been happening to investment inside and outside the energy sectors in the two countries.
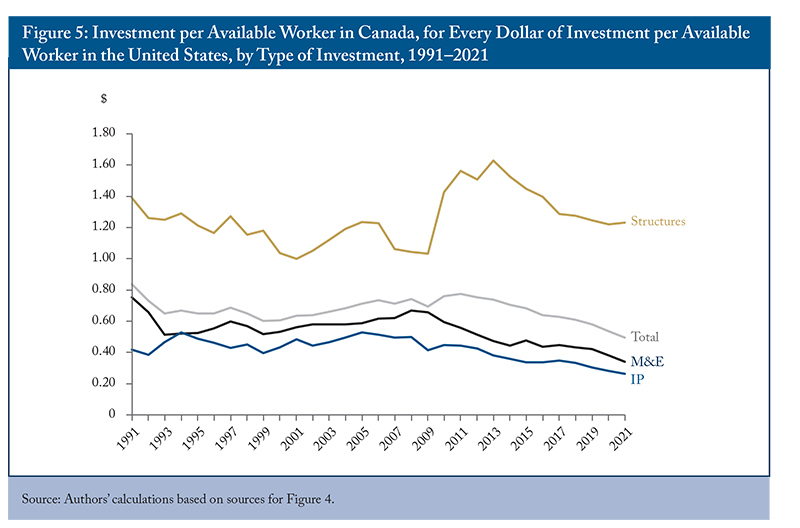
Figure 6 compares investment per available Canadian and US worker in oil and gas extraction – the part of the energy sector most acutely affected by shifting fortunes since 2015 – and in the rest of the two economies. As in Figure 5, the denominator is a dollar invested per member of the US workforce: the figure shows how many cents that potential worker’s counterpart in Canada enjoyed each year. The figure clearly demonstrates the troubles in Canada’s oil and gas sector. Although investment held up relatively well in Canada shortly after the collapse in oil prices, Canada’s relative performance deteriorated sharply after 2016. Canadian oil and gas workers received almost as much investment per person at the peak in 2016, but in 2020 they received barely more than half as much.
This breakdown underlines the impact of the investment decline in Canada’s oil and gas industry on Canada’s relative investment performance. As just noted, however, investment in US oil and gas extraction held up better, suggesting that something beyond low prices was hurting the Canadian industry. Also troubling is that fact that investment per available worker in the rest of Canada’s economy is so low compared to the equivalent US measure. Higher capital intensity elsewhere in the economy would give us more confidence that a shrinking energy sector did not mean lower output and incomes for workers. But investment per available worker in Canada outside oil and gas extraction has been less than half the US level for years. Although it rose modestly toward 50 cents in 2018 and 2019, it fell to about 44 cents in 2020. Outside the energy sector, as in it, Canadian workers are getting much less new capital than their US counterparts.
Canada versus the OECD
Although the United States is Canada’s closest trading partner and competitor, and thus a natural point of comparison, it has a unique industrial structure and economic cycles. However, further perspective on Canada’s situation is available from a wider comparison. In this section, we extend our view to other OECD countries and take advantage of OECD projections to say something about how Canada appears likely to fare comparatively in 2021 and into 2022.
This broader and more forward-looking view comes with caveats. Not all OECD countries break down business investment by type as Canada and the United States do, and not all measure IP products the same way. So we use aggregate investment with less confidence that we are comparing like with like. We also do not have current measures of relative prices for different types of investment. Therefore, we resort to a less precise bang-per-buck adjustment: purchasing-power-adjusted exchange rates benchmarked to relative prices of investment goods in 2008.
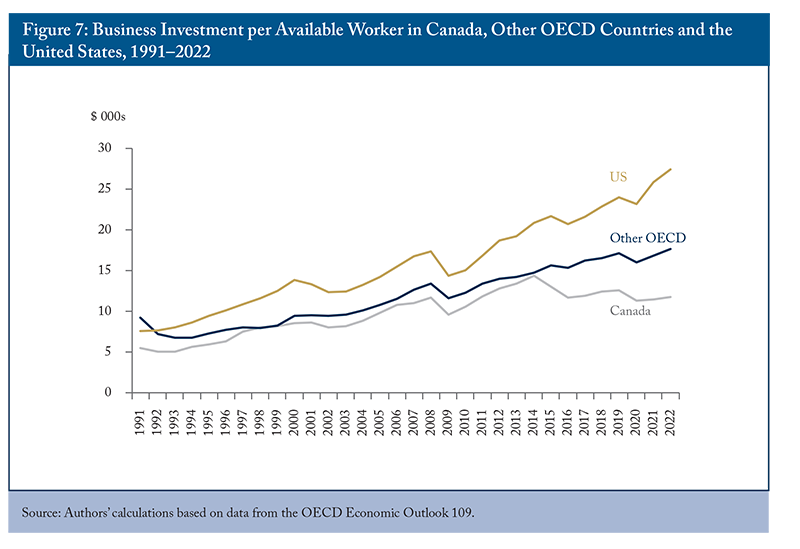
For consistency, we use the same OECD measures for the United States as well, which means that the per-available-worker numbers in Canadian dollars are not identical to those in our Canadian-US comparison. But the big picture – notably, the story of Canadian underperformance – is consistent (Figure 7).
Investment per available worker in OECD countries outside of Canada and the United States has been less robust than in the United States, but more robust than in Canada – except for the early 2010s when Canada’s resources sector was booming and many other advanced economies were still suffering from the lingering effects of the 2008–2009 crisis and slump. Lately, the gap between Canada and OECD countries other than the United States has been unprecedentedly wide. The OECD’s projections for 2021 yield a figure of $16,900 of new capital per available worker this year for the rest of the OECD compared to $12,300 for Canada. Its projections for 2022 yield figures of $17,700 for the rest of the OECD, compared to $12,700 for Canada. In other words, the OECD’s projections for countries other than Canada and the United States indicate that new capital per available worker in Canada will be more than one-quarter less than in those countries this year and next.
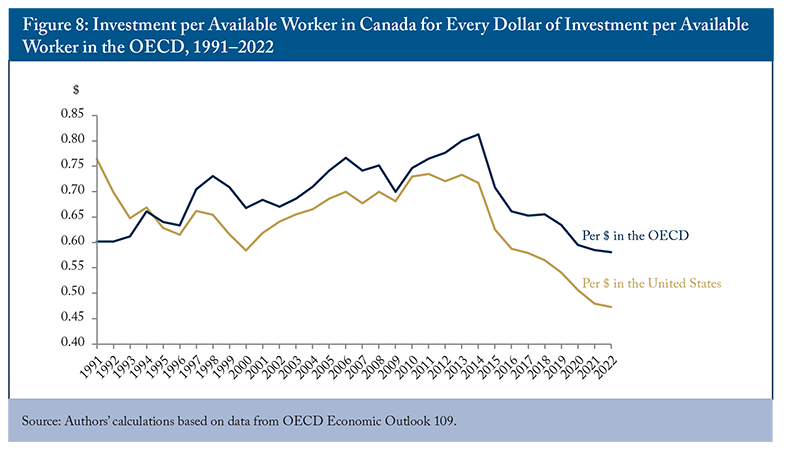
As we did above against the United States alone, we highlight Canada’s relative performance by showing Canadian investment per available worker per dollar elsewhere. Figure 8 shows how much new capital each available worker in Canada enjoyed per comparative dollar in the United States and the OECD as a whole since 1991, along with the figures calculated from the OECD’s projections for 2021 and 2022.
A long-standing gap between investment rates in Canada and those abroad narrowed between the late 1990s and the mid-2000s. For every dollar of investment enjoyed by available workers in the OECD as a whole, their Canadian counterparts enjoyed about 75 cents in the early 2000s. By 2014, the average available worker in Canada was enjoying somewhat more: 81 cents. In 2021, however, Canadian workers will likely enjoy only something like 58 cents of new capital for every dollar enjoyed by their counterparts in the OECD as a whole, and the OECD’s projections yield the same 58-cent figure for 2022. Against the United States, the OECD’s projections yield figures of 48 cents for 2021 and 47 cents for 2022.
Higher investment rates are not a goal in their own right. Spurring investment in non-economic assets with subsidies or regulation could raise capital spending but lower productivity and future incomes. Our reason for concern at these numbers is that they suggest that Canadian businesses are not seeing opportunities and threats that would prompt them to undertake productivity-improving capital projects, or that they are seeing those opportunities and threats but are not responding to them. To that extent, these numbers prefigure a troubling outlook for Canadian workers. Countries with higher capital intensity tend to have higher productivity and higher wages. Countries with lower capital intensity tend to have lower productivity and lower wages. We want Canada to be in the first category, not the second.
Equipping Canadian Workers Better
Since 2015, Canada’s stocks of capital per worker have been stagnant or declining and its rates of gross investment per worker have been weak. Moreover, business investment in Canada has been feeble compared to investment in the United States and other countries, a contrast that appears to have worsened during COVID-19.
The premise for the long-term projections in the 2021 federal budget was sustained faster output growth – faster growth that was desirable not only because of its implications for Canadian living standards but central to the budget’s projections of a manageable debt burden (Drummond and Laurin 2021). Yet the budget’s measures were heavy on transfer payments and direct federal consumption spending and light on tax or other framework measures that would raise productivity, spur business investment and increase Canada’s future capacity to generate goods and services, along with high incomes for workers.
Among potential reasons for recent weak business investment in Canada are the relative stringency of COVID-related lockdowns, inadequate infrastructure – notably in energy transportation – tax structures and rates that drive a wedge between pre- and post-tax returns on capital projects. As well, Canada suffers from a fragmented internal market and other factors that dampen competitive pressures that force businesses to upgrade. It also suffers from trade uncertainty, unnecessarily heavy regulatory burdens, policies that favour residential housing over other kinds of investment and obstacles to financing by small and medium-sized businesses.6These have been detailed in past C.D. Howe Institute research. Dachis (2018) details the cost of inadequate market access for Canadian fossil fuels. Found and Tomlinson (2017) document the investment-discouraging impact of business property taxes in major cities, and McKenzie and Smart (2019) show how Canadian corporate taxes create a less favourable environment for investment than US corporate taxes. Dachis and Lester (2015) describe growth-inhibiting effects of preferential tax treatment for small businesses. Alvarez, Krznar and Tombe (2019) show how barriers in Canada’s internal market reduce output. With respect to access to funds, Kronick and Omran (2019) discuss the high cost of credit to smaller businesses, Powell (2020) shows how asset-based finance could improve and Lortie (2019) suggests ways to improve private-equity finance. Recent federal framework policies in areas such as telecommunications and pharmaceuticals prioritize short-term benefits for current consumers over the long-term benefits of investment and higher output. The mutually reinforcing nature of productivity and investment mean that Canada’s low investment rates are both a symptom of lower productivity than we should aspire to and signs that future productivity will be lower than we want.
Conclusion
After improving against international competitors during the 2000s and early in the 2010s, business investment per available worker in Canada slipped badly after 2014 and has been conspicuously weak during the pandemic. This weakness is both a likely effect of weak productivity growth in the present and a harbinger of weak productivity growth in the future. It means that Canadian workers will have less capital – less nonresidential building and engineering, less M&E and less in the way of IP products – with which to produce goods and services, earn incomes and fund public services in the years to come.
The prospect that Canadians will find themselves increasingly relegated to lower value-added activities relative to workers in the United States and elsewhere, who are raising their productivity and earnings faster, should spur Canadian policymakers to action. The first step is to recognize that recent trends are a symptom of threats to Canada’s prosperity and competitiveness – that low business investment is a problem that governments can and should address.
The authors thank Alexandre Laurin, Daniel Schwanen, Jock Finlayson, William Molson, Jason Stewart, Trevor Tombe, Tom Wilson and anonymous reviewers for helpful comments on an earlier draft. The authors retain responsibility for any errors and the views expressed.
References
Alvarez, Jorge, Ivo Krznar, and Trevor Tombe. 2019. “Internal Trade in Canada: Case for Liberalization.” IMF Working Papers 19/158. Washington, DC: International Monetary Fund. July 22.
Dachis, Benjamin. 2018. Death by a Thousand Cuts? Western Canada’s Oil and Natural Gas Policy Competitiveness Scorecard. Commentary 501. Toronto: C.D. Howe Institute. February.
Dachis, Benjamin, and John Lester. 2015. Small Business Preferences as a Barrier to Growth: Not so Tall After All. Commentary 426. Toronto: C.D. Howe Institute. May.
Drummond, Donald, and Alexandre Laurin. 2021. “Rolling the Dice on Canada’s Fiscal Future.” E-Brief. Toronto: C.D. Howe Institute. July.
Found, Adam, and Peter Tomlinson. 2017. “Business Tax Burdens in Canada’s Major Cities: The 2017 Report Card.” E-Brief. Toronto: C.D. Howe Institute. December.
Kronick, Jeremy, and Farah Omran. 2019. Productivity and the Financial Services Sector – How to Achieve New Heights. Commentary 555. Toronto: C.D. Howe Institute. October.
Lortie, Pierre. 2019. Entrepreneurial Finance and Economic Growth: A Canadian Overview. Commentary 536. Toronto: C.D. Howe Institute. February.
McKenzie, Kenneth, and Michael Smart. 2019. Tax Policy Next to the Elephant: Business Tax Reform in the Wake of the US Tax Cuts and Jobs Act. Commentary 537. Toronto: C.D. Howe Institute. March.
Marple, James. 2021. “Meeting Canada’s Innovation Challenge through Targeted Investment and Competition.” TD Economics. July.
Powell, David. 2020. Filling the Gap: Emergency Funding Programs and Asset-Based Finance in Times of Economic Crisis. Commentary 569. Toronto: C.D. Howe Institute. March.
Rao, Someshwar, Jianmin Tang, and Weimin Wang. 2003. “Canada’s Recent Productivity Record and Capital Accumulation.” International Productivity Monitor. Centre for the Study of Living Standards. 7:24-38. Fall.
Robson, William B.P., and Miles Wu. 2021. “From Chronic to Acute: Canada’s Investment Crisis.” E-Brief. Toronto: C.D. Howe Institute. February.
Sala-i-Martin, Xavier. 2001. “15 Years of New Growth Economics: What Have We Learnt?” Speech, Fifth Annual Conference of the Central Bank of Chile. November.
Statistics Canada. 2016. “User Guide: Canadian System of Macroeconomic Accounts. Chapter 5 Income and expenditure accounts.” Catalog No. 13-606-G. August.
Stewart, Luke A., and Robert D. Atkinson. 2013. “Restoring America’s Lagging Investment in Capital Goods.” The Information Technology & Innovation Foundation. October.