






by Pierre-Pascal Gendron and Richard M. Bird
 With the federal government projecting swelling budget deficits in the Fall Economic Statement and then the 2021 Budget due to pandemic relief measures, debate is shifting to the revenue raising measures needed to pay for them.
- But before raising broad-based taxes, governments should evaluate whether existing taxes, at current tax rates, are raising the revenue they should, i.e., is there a “tax gap” to be closed?
- The authors focus on the “compliance gap,” which includes not only tax evasion and avoidance, but also intentional or unintentional taxpayer errors, as well as, in some cases, unpaid and even uncollectible tax liabilities. It is important to understand that the gap is conceptual, and that it can never be fully eliminated.
- After reviewing measurement methods and issues, and surveying international experience, the authors provide a reasonable estimate of the total tax gap based on the latest Canada Revenue Agency reports to be between 6.4 percent and 8.3 percent of total tax revenues. Of that gap, the CRA could reasonably recover about $3 billion through additional administrative resources and effort. Every little bit helps, but no matter how much the administration of the existing law can and should be improved, it alone is most unlikely to resolve the eventual revenue crunch if expenditures are to be maintained, let alone further expanded.
- The authors make several recommendations for the agency, including updating its gap estimates to more recent tax years as is the practice in the UK and EU; redeveloping the presentation of its estimates to feature pre- and post-audit figures consistently; and developing a communications campaign to explain its work on the tax gap to the public and the media.
 With the federal government projecting swelling budget deficits in the Fall Economic Statement and then the 2021 Budget due to pandemic relief measures, debate is shifting to the revenue raising measures needed to pay for them.
The massive government spending in response to COVID-19, especially if some of the elevated expenditure pattern is sustained, is likely in time to require some increase in revenues to restore fiscal balance (Smart 2020). For their part, Hodgson and van Dijk (2020) and van Dijk and Hodgson (2020) argue that the best way to increase revenues is through consumption taxes, which are not only more efficient revenue instruments than other taxes but may, if properly designed, be moderately progressive. Others have suggested increasing taxes on digital services, as announced in the latest federal budget, or restructuring income taxes to be more efficient, equitable and revenue productive (for example, by limiting interest deductibility or taxing capital gains more effectively and evenly).
Some such ideas may be sounder than others, but they all ignore an important question: before tackling the political challenge of raising broad-based taxes, should governments first evaluate whether existing taxes, at current tax rates, raise the revenue they should? Recent research on the situation in the United States is instructive. Sarin and Summers (2019, 2020) suggest that up to US$1 trillion in additional taxes might be raised over the next decade simply by strengthening the administrative effectiveness of the existing tax structure to collect a relatively small share of the estimated tax gap – the 15 percent of US “owed taxes” (or about 17.5 percent of actual US revenues) not presently collected.
Is there a similar revenue bonanza to be reaped in Canada? To approach this question, one must first explore more carefully the concept of tax gap. The Canada Revenue Agency (CRA 2016a, 7) defines the tax gap as, “the difference between the taxes that would be paid if all obligations were fully met in all instances and the tax actually paid and collected.” Since not everyone necessarily agrees with CRA’s perception of what is meant by “fully meeting” tax obligations, and different people may mean different things when they talk about tax gaps, we first consider this definition and clarify the terminology of tax gaps. We then explore how tax gaps are measured and look briefly at international experience with doing so before discussing how gap estimates, although inherently only rough and subject to question, may nonetheless be of value not only to the CRA and the Department of Finance but also to the public at large. Finally, we provide a preliminary – and necessarily approximate – estimate of the extent to which the current fiscal gap can be dealt with by closing the tax gap.
Mind the Gaps
There is no simple, common understanding of “tax gap” either in popular discussion or in the growing literature on this subject. There are different gaps, and different versions of each. Although much popular discussion not only confuses different gap concepts and often even brings in the even more vague notion of the so-called “shadow economy,” for the most part such discussion focuses on tax evasion – illegal ways in which people fail to pay what they should. The gap concept that provides the best basis to approach this issue, as the earlier quote from the CRA indicates, is the compliance gap, which is the major focus of this paper. (See Box 1 for an overview of how this gap’s measure is related to the conceptually quite distinct policy gap.)
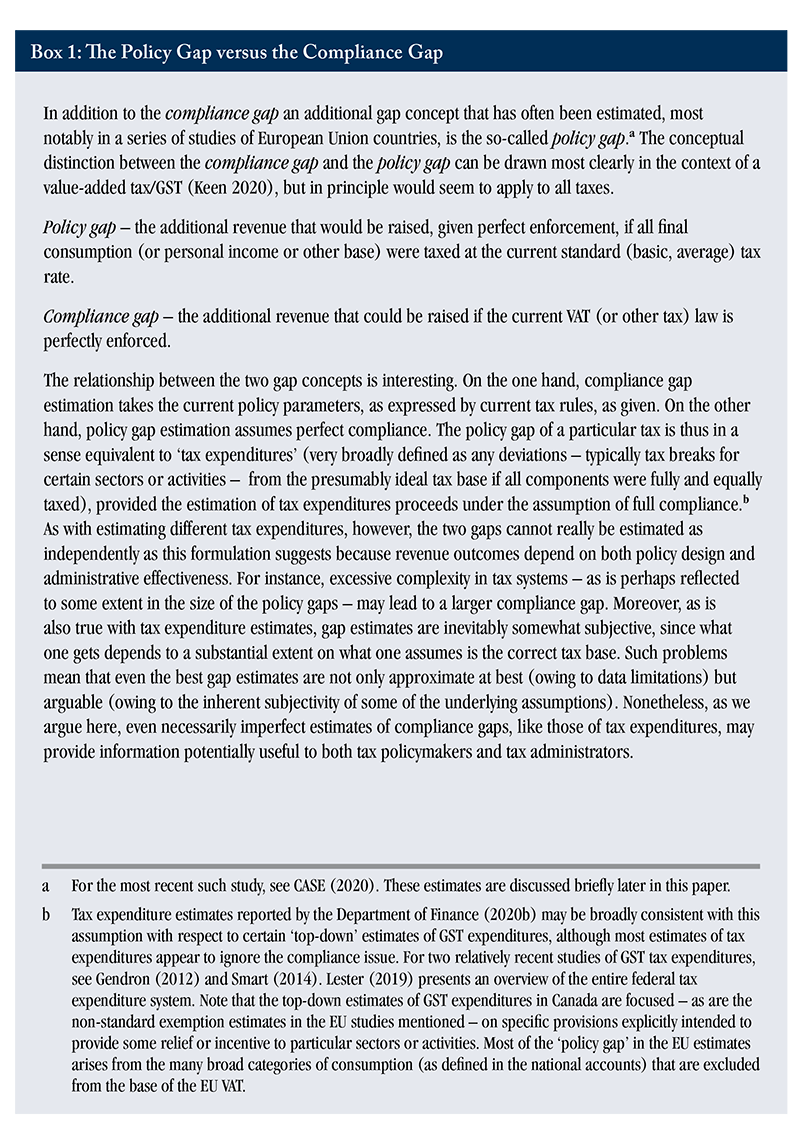
As the CRA quote indicates, however, the compliance gap includes not only tax evasion but also intentional or unintentional taxpayer errors, as well as, in some cases, unpaid and even uncollectible tax liabilities. The measured compliance gap may also include to some extent tax avoidance, particularly when measured from the top down (as discussed below) or if the revenue authority bases its estimates, as is usually the case, on what it considers to be conceptually, if not always (or necessarily, in the eyes of the courts) legally, as equivalent to outright evasion.1In the UK, for example, where the estimated tax gap is closer to 5 percent of potential revenue than to the 15 percent gap in the US mentioned earlier in the text, only about 15 percent of the estimated tax gap is reportedly attributable to what is called ‘evasion” and an additional five percent to “avoidance” (HMRC 2020a). However, another 14 percent is attributed to organized criminal activities (e.g., smuggling), which are illegal in themselves, 10 percent to the so-called “hidden economy” (much of which is likely very small-scale in nature), and 16 percent to “legal tax interpretation” (which seems mainly to cover transactions that HMRC (2020b) – though not as yet the courts – interprets as against the intent of Parliament). The balance (40 percent) is attributed to taxpayer error, failure to report properly, or simply failure to pay (e.g., owing to bankruptcy). A non-negligible share of the estimated compliance gap thus arguably reflects issues related to how tax laws are interpreted as well as administrative issues in capturing the taxes legally due.
However defined, tax gaps may be expressed in monetary units or as a relative indicator such as percentage of potential tax revenue. Tax gap estimates are usually made only for particular taxes such as the corporate income tax (CIT), the personal income tax (PIT), and the goods and services tax/harmonized sales tax (GST/HST), with the overall tax gap being simply the sum of these separate estimates.2Actual estimation usually ignores potential interdependence between the separate estimates, e.g., between the PIT gap and the CIT gap, or the GST gap and the excise gap. The interdependence would seem easier to model in the case of consumption taxes.
Measurement, Uses and Limitations of Tax Gaps
A significant amount of data is required to estimate tax gaps. The two main approaches to estimating gaps are the top-down approach and the bottom-up approach.3Space limitations preclude anything more than a superficial description of those methodologies, based largely on CRA (2016a). For a more detailed discussion of estimation methods for VAT/GST gaps – the simplest case – see Gendron and Bird (2020) and for a particularly full discussion of how such gaps are estimated for almost all taxes in the UK, see HMRC (2020a, b). We briefly review both in turn.
The top-down methodology relies on data external to the tax administration to estimate the potential tax base and the tax that should be paid and collected. This potential tax is then compared to the actual tax paid, and the tax gap is simply the difference between the actual and the estimated potential tax. The data used to make these calculations come from such sources as the national accounts, supply and use tables, and household expenditure surveys. Using such data often requires considerable adjustments owing to the varying level of aggregation in these sources and also assumes that the reported data are not affected by non-compliance and provide a useful (if never fully accurate) measure of the appropriate tax base. Despite these limitations, the top-down approach is well suited to gap estimation for such indirect taxes as VAT/GST, excises, and import duties.
In contrast, the bottom-up methodology begins with detailed taxpayer-level data on non-compliance and other operational data collected by the tax administration.4For details about the estimations (and limitations of the estimations) for particular taxes, see the various CRA reports in the reference list at the end of this paper. Data collection relies on random audit programs, data matching methods and a variety of statistical methods such as clustering and extreme value analysis. The bottom-up approach is well-suited to estimate direct tax gaps such as the PIT and CIT gap. It may also sometimes be used to validate or check the robustness of top-down estimates and may also be directly useful to the tax administration in identifying areas needing closer attention.
Use of Tax Gap Estimates
As CRA (2016a, 22-23) notes, tax gaps are useful both in providing “insight into the overall health of the tax system” and “understanding the scale and composition of non-compliance.” The primary indicator of the “health” of the tax system is the size of the gap and its causes. Policy gap estimates like those mentioned in Box 1 are presumably most useful to those (e.g., the Department of Finance) responsible for tax policy. From the CRA’s (tax administration’s) perspective, understanding various aspects of non-compliance is necessary in order to properly allocate resources to combat it through, for instance, a greater focus on auditing (risk-based and sometimes random) as well as more use of information technology and analytics.
Estimating tax gaps is costly, and the benefits from doing so are enhanced when the estimates are disclosed to the public. Such disclosure follows a logic similar to that supporting the release of tax expenditure estimates (Department of Finance 2020b), which estimate the tax revenue loss from tax breaks given to certain sectors or activities. Indeed, the case for releasing tax gap estimates is perhaps more compelling because the concept of a tax gap, despite the looseness with which the term is often used by the press, is easier to grasp than that of a tax expenditure. Disclosure would seem to send a presumably credible signal that the tax authority cares about the gap and wants to take action to reduce it.5The gap cannot be closed fully because, for example, as noted earlier (see note 1 supra) it includes uncollectible amounts (e.g., bankruptcy). Perhaps less understandably to most, it also should not generally be closed because there is always a less than complete optimal (tolerable) level of non-compliance in any enforcement system; that is, a point at which the economic cost of closing the gap exceeds the likely benefit from doing so. Such signals might promote better compliance, although as yet there is no clear evidence to support this speculation. Indeed, in some situations, disclosing a large tax gap – a public admission that many individuals and businesses do not comply – might undermine public morale and compliance. Some may – as in the US case mentioned earlier – see ‘closing the gap’ as a politically (and perhaps economically) easier way to achieve fiscal sustainability than imposing new (or higher) taxes. On the other hand, a small tax gap may signal that there is no problem and that the tax administration should not worry too much about it. The considerable potential for misinterpretation and misuse of gap estimates (Björklund Larsen 2017) means the authorities must pay careful attention to proper framing when they release estimates and, ideally, be prepared to discuss their methods, results, the actions that might be taken to reduce the gap, and the conditions required to make these actions feasible.
Limitations of Tax Gap Estimates
The precision and reliability of tax gap estimates depend on the availability and quality of data, the estimation methods used, and the incidence of sampling and systematic errors. Combining different methods may help increase reliability of estimates but is more costly. The quantity of data also matters if random audits are used. As the CRA points out in its various reports, random audits or risk-based audits may be preferred depending on the type of tax.
Timeliness also matters. Depending on the estimation method, the production of tax gap estimates can involve a significant time lag between the conclusion of a tax year and the eventual closing of administrative transactions related to that tax year. Examples include ongoing audits, future reassessments, and so on. These issues arise to some extent with all gap estimates but are especially difficult with respect to business income taxes.
Tracking the behaviour of the tax gap over time, and distinguishing changes in non-compliance from cyclical factors and/or major tax policy changes, ideally requires both annual estimates and, if there are adjustments, reconciled estimates in future years.
A final consideration concerns the interpretation of estimates. The relative positions of the CRA and taxpayers (and their tax advisors) may be contingent on each party’s interpretation of what the gap is. The official estimates, of course, reflect the CRA’s assumptions about compliance but as several reviewers of earlier versions of this paper made clear, not everyone agrees with these assumptions.
International Experience
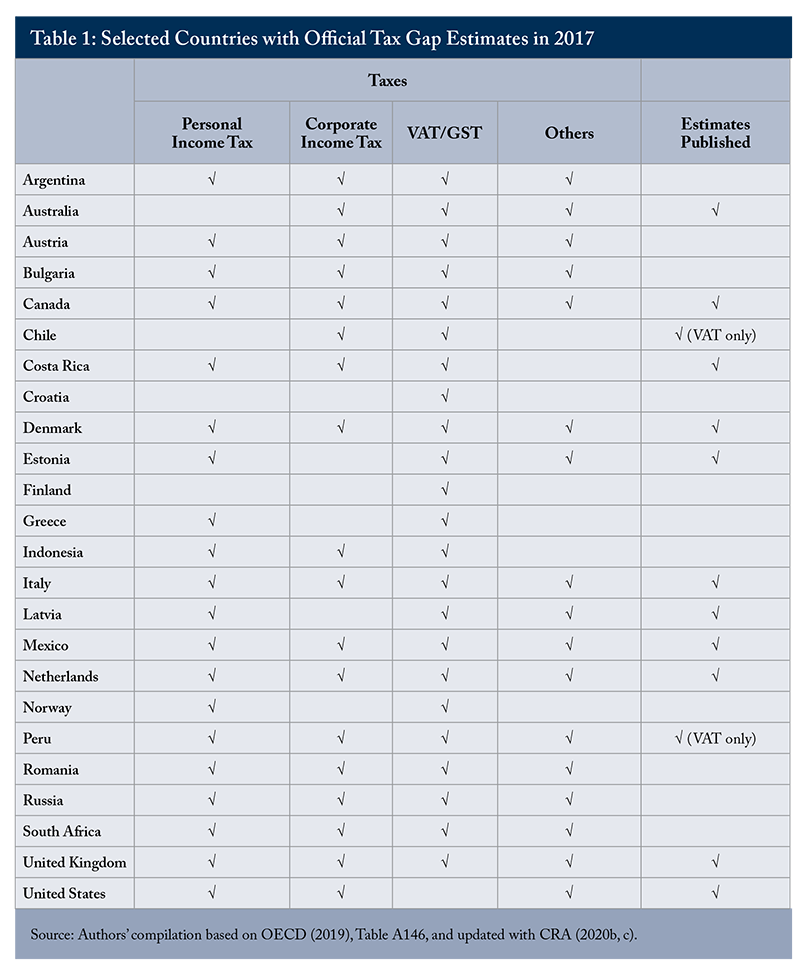
Table 1 (the most recent comparative list available) shows that many countries already made official tax gap estimates in 2017, although few, if any, met the standards just suggested.6As Gendron and Bird (2020) note, gap estimates have been made from time to time for countries other than those listed in Table 1, often with technical assistance from the IMF, as noted below. Others may have done so more recently: for example, Canada released its first official tax gap estimates for excise taxes on tobacco (CRA 2020b) and its first official payment tax gap estimates (CRA 2020c) in December 2020.7The payment gap results from payment non-compliance and was calculated for the PIT, CIT, GST/HST and excise duties and taxes. All the countries listed in Table 1 use formal risk management practices to administer taxes. In some, the ministry of finance requires tax administrations to estimate tax gaps. In others, tax administrations conduct their own research on the tax gap. Some, like Canada, make all results available to the public. Different methodologies, including random audits, are used to make the estimates in different countries. The remainder of this section briefly outlines some of the most advanced gap-estimation programs.
United Kingdom
The United Kingdom operates what is perhaps the most extensive tax gap program.8The UK’s ‘bottom-up’ estimates are especially detailed, as mentioned in note 1 supra. For example, 43 percent of the total tax gap is attributed to small business (HMRC 2020a), while (as mentioned in note 1) only 15 percent of the total is said to be due to evasion. As Klassen and Pantaleo (2020) stress, although tax gap estimates can be used to improve the performance of the administration, they should not, as HMRC (2020a) also notes, be used to establish explicit targets for auditors or to assess their performance. Doing so may, as De la Feria (2020) argues, induce tax administrators to focus enforcement selection on ‘easier’ targets (notably large companies) rather than on curbing outright tax fraud. It covers personal contributions and taxes (Income Tax, National Insurance Contributions, and Capital Gains Tax), the value-added tax (VAT), the Corporation Tax, excise duties, other indirect taxes (Aggregates Levy, Air Passenger Duty, Customs Duty, Climate Change Levy, Insurance Premium Tax, Landfill Tax, and Soft Drink Industry Levy), and other direct taxes (stamp duties and Inheritance Tax). The latest estimates cover the years 2018 to 2019.
Australia
Australia reports its tax gap estimates under three headings.9For further details, see Australian Taxation Office (2020). The first covers transaction-based tax gaps, which are estimated for the goods and services tax, the fuel excise tax, the tobacco tax, and the wine equalization tax. The second consists of income-based tax gaps, which are reported for high wealth income tax, for “individuals not in business,” for small business, and for a few other special cases such as pension funds and petroleum resource rents. The last deals with the compliance gaps for certain administered programs such as fuel tax credits, PAYG (pay as you go) withholding, and superannuation guarantee. The latest published estimates cover the year 2015/16.
United States
The US operates a tax gap program that covers the individual income tax, the corporation income tax, the employment tax, and the estate tax.10For further details, see US Internal Revenue Service (2019). The latest estimates cover the years 2011 to 2013 and served as basis for the US Congressional Budget Office (2020) estimates of potential revenue increases from increasing resources allocated to tax administration as well as the (considerably larger) estimates by Sarin and Summers (2019, 2020) mentioned earlier.
Canada
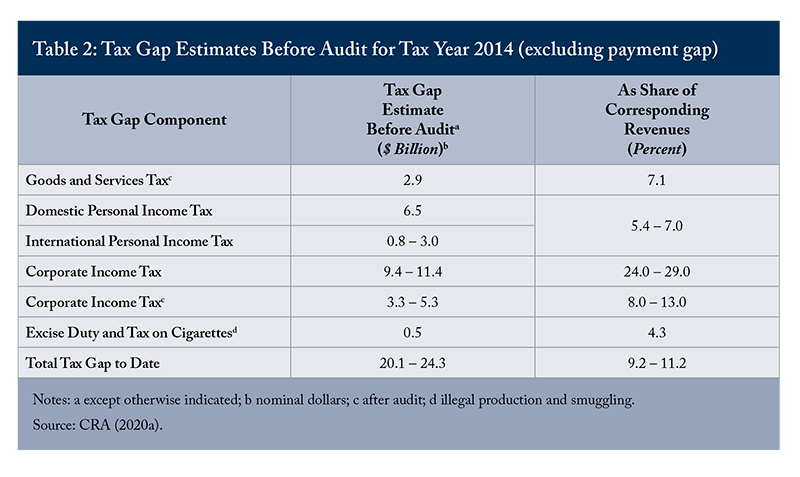
So far, the CRA has produced tax gap estimates and separate reports for the GST/HST (CRA 2016b), the federal personal income tax (CRA 2017), the federal corporate income tax (CRA 2019), the international tax gap for the federal personal income tax (CRA 2018), and the excise tax on cigarettes (2020b). The latest estimates cover the tax years 2000 to 2014 for GST/HST, and (essentially) fiscal 2014 for other taxes mentioned. The results of these reports for the tax year 2014 are shown in Table 2 and discussed below. In addition, another recent report (CRA 2020c) estimates the payment gap – that is, the extent to which taxes assessed (after reassessments, audits, appeals and collection efforts) have not been paid. While not directly comparable to the other reports because it is based entirely on CRA accounting data and importantly, includes all subsequent adjustments, it is interesting to note that the initial payment gap estimated at $5.3 billion in 2014 had been reduced to $2.2 billion by 2020.
European Union
The European Commission sponsored a research program on income tax gaps with the participation of 16 member states in 2018 (European Commission 2018a, b), but did not reach sufficient consensus on the methodology to apply it to all member states. The situation with VAT is very different because of the long-established role of the Commission in determining the ‘common’ VAT framework within the EU. After sponsoring an initial effort (Reckon 2009) to estimate VAT gaps, the Commission sponsored annual estimates since 2013 by a third party of VAT gaps for all member states using a common methodology. The latest report, covering both compliance and policy gaps is for 2020 (CASE 2020).
International Monetary Fund
The IMF’s Revenue Administration Gap (RA-Gap) program has estimated the VAT gap for a number of years and for a variety of countries using a common methodology. The first publicly available report (for Estonia) dates back over a decade and was subsequently updated (Thackray and Ueda 2014). Hutton (2017) describes the methodology and Bird and Gendron (2020) summarize the results of all RA-Gap reports made public so far (as well as additional country studies made on an occasional basis by other international agencies like the World Bank and CIAT (Inter-American Center of Tax Administrations) as well as some academic researchers.
Opportunities for Canada
This section first discusses how much more in federal revenues could potentially be raised from improving compliance. It then turns to other priorities related to tax gaps.
How Much Revenue from Improving Compliance?
Table 2 shows the official federal gap estimates for 2014 (in current 2014 dollars) from the latest CRA report (CRA 2020a). Adding together pre- and post-audit numbers is obviously not ideal. In any case, it is difficult to understand why the total gap reported by CRA (as shown in Table 2) includes the pre- rather than the post-audit gap for CIT. This shifts the bulk of the larger pre-audit gap estimate of $20-$24 billion to the corporate sector, whereas the $14-$16 billion post-audit gap attributes the bulk of the gap to the PIT. Based on past experience, and using the data shown in Table 2, a more reasonable estimate of the total tax gap in 2014 would perhaps lie between $14.0 and $18.2 billion, or between 6.4 percent and 8.3 percent of the actual total revenues implied by the last row of Table 2: $218.5 billion. A quick but conservative current dollar tax gap extrapolation is possible by multiplying the percentage shares of 6.4 and 8.3 by total actual revenues of $264.5 billion in fiscal year 2019/20 for the taxes for which gaps have been estimated11This excludes the cigarette excise since tobacco excises are not reported separately in the Fiscal Reference Tables (Department of Finance 2020c). Figures above do not add up exactly due to rounding. (domestic plus non-resident PIT, $177.1 billion; CIT, $50.1 billion; and GST/HST, $37.4 billion). With these assumptions, the total tax gap for 2019/20 would range between $16.9 and $22.0 billion.
So we return to our question: How much revenue could be raised from improving compliance and reducing this gap? Some seem to think huge amounts of revenue could be collected simply by exerting a bit more effort to ensure taxpayers fully comply with the tax laws in place. For example, The Conference Board (2017) estimated that the federal government lost almost as much as $50 billion in revenue as a result of inadequate collection efforts.12A recent CBC post (Radio-Canada Info 2019) similarly plays up the biggest number in the CRA report on CIT as a possible revenue gain, failing to mention the much lower estimates in that report of the probable size of the gap after audits and appeals finally work through the system. However, this estimate simply assumed that the tax gap in Canada is the same size as that estimated in the US. Actually, as the CRA studies now available suggest, although the numbers calculated in each country are clearly not directly comparable owing to differences in methodologies as well as in tax systems, it seems more likely that the size of the gap is greater than that in the UK (about 5.3 percent of actual revenue) but definitely less than that in the US (about 17.5 percent of actual federal revenue). Even if additional administrative resources and effort could be mustered and applied as effectively in Canada as assumed by Sarin and Summers (2020) – who incorporate strong deterrence effects in their analysis of the US – the effect would be only to increase revenues by perhaps at most $3 billion or so a year.
A billion here, a billion there is not chicken feed. Every little bit helps – but $3 billion, or even a highly improbable $5 billion, will not do much to establish a more sustainable long-term fiscal balance in the (perhaps long) post-COVID recovery period. Devoting more resources to improving administration provides an important demonstration that governments can be trusted to at least enforce tax laws fairly and equally. It will also increase revenue yields. But no matter how much the administration of the existing law can and should be improved, it alone is most unlikely to resolve the eventual revenue crunch if expenditures are to be maintained, let alone further expanded. Unless a substantial increase in growth occurs to shore up revenues, some changes in tax policy are also likely to be needed.
Conclusion
Even with the 2020 update and additions, the published tax gap studies available for Canada (CRA 2016b, 2017, 2018, 2019, 2020b, 2020c) are now quite dated, with the most recent tax year covered being 2014. A first priority is to update estimates and keep doing so.
One concern may be that subsequent audits may change the results for a given year, but this might or might not be a serious problem depending on the tax. Based on CRA (2016b), GST/HST revenue adjustments for tax year 2014 amounted to less than 2 percent of GST/HST actual and assessed revenue. Unsurprisingly, the picture changes dramatically with the corporate income tax: CRA (2020a) showed that the corporate tax gap in tax year 2014 was in the range of 24 percent to 29 percent of revenues before audits but only 8 percent to 13 percent after audit results. As other studies (e.g., CASE 2020) have shown, it is not difficult to show adjustments, as required, in later reports.
What has to be emphasized is that all tax gap estimates are inherently simply estimates, and estimates as good as possible now, rather than perhaps more precise later, are more useful to administrators, policymakers and the public. If the CRA has calculated newer estimates, it should therefore release them without delay. The immediate goal, for example, should be to have as clear a picture as possible of the likely size and nature of the compliance gap as it stood just before COVID-19 in order to provide a basis for the CRA to target its enforcement resources and actions to reduce the compliance gap.
As CRA (2020b) demonstrates for cigarette excises, the CRA can and should extend its gap estimates to other arguably economically efficient and perhaps, underexploited taxes such as excise duties on alcohol and fuels. These levies also have important policy gaps because the rates are largely specific and not indexed to inflation so yields have not grown with the economy (Bird and Smart 2016). Federal excise revenues have shown a declining trend relative to total tax revenues. Gasoline and other motive fuel tax revenues have, for example, shown a declining trend since the mid-1990s. Alcohol and tobacco tax revenues have shown an overall declining trend for a long time.
Tax gap estimates, particularly detailed bottom-up estimates, may provide some useful guidance in how best to tackle the compliance gap, as well as a publicly visible target that will undoubtedly focus more attention on the problem. However, experience around the world suggests that reducing compliance gaps to raise revenue is a more difficult, longer and more resource-intensive task than most people seem to understand. Nonetheless, although even an increased and more effective administrative effort is unlikely to solve the post-pandemic budget problems that may face Canadian governments, improving tax compliance is important and may also help strengthen public trust in the fairness of the system. Good and current gap estimates will help.
Summary of Recommendations
- CRA should update its gap estimates to more recent tax years as is the practice in the UK and EU.
- CRA should redevelop the presentation of its estimates to present pre- and post-audit figures consistently and make assumptions with respect to subsequent audit adjustments in order to produce more timely estimates.
- CRA should develop a communications campaign to explain its work on the tax gap to the public and the media.
The authors thank Alexander Laurin, Farah Omran, Nick Pantaleo, William B.P. Robson, Jeffrey Trossman, Tom Wilson, anonymous reviewers and members of the Fiscal and Tax Competitiveness Council of the C.D. Howe Institute for comments on an earlier draft. The authors retain responsibility for any errors and the views expressed.
References
Australian Taxation Office. 2020. Australian Tax Gaps Overview. Canberra: Australian Government.
Bird, R., and M. Smart. 2016. “Finances of the Nation – Taxing Consumption in Canada: Rates, Revenues and Redistribution.” Canadian Tax Journal 64(2): 417-442.
Björklund Larsen, L. 2017. “Mind the (Tax) Gap: An Ethnography of a Number.” Journal of Cultural Economy. 10(5): 419-433.
Canada Revenue Agency (CRA). 2016a. Tax Gap in Canada: A Conceptual Study. Ottawa, ON: Government of Canada.
_________. 2016b. Estimating and Analyzing the Tax Gap Related to the Goods and Services Tax/Harmonized Sales Tax. Ottawa, ON: Government of Canada.
_________.2017. Tax Assured and Tax Gap for the Federal Personal Income Tax. Ottawa, ON: Government of Canada.
_________. 2018. International Tax Gap and Compliance Results for the Federal Personal Income Tax. Ottawa, ON: Government of Canada.
_________. 2019. Tax Gap and Compliance Results for the Federal Corporate Income Tax. Ottawa, ON: Government of Canada.
_________. 2020a. Tax Gap: A Brief Overview. Ottawa, ON: Government of Canada. (accessed on April 9, 2021).
_________. 2020b. Tax Gap for Federal Excise Duty on Cigarettes. Ottawa, ON: Government of Canada, December.
_________. 2020c. Payment Tax Gap and Collection Efforts. Ottawa, ON: Government of Canada, December.
CASE. 2020. Study and Reports on the VAT Gap in the EU-28 Member States: 2020 Final Report. Warsaw: Center for Social and Economic Research.
Conference Board. 2017. Canadian Tax Avoidance: Examining the Potential Tax Gap. Ottawa, ON: The Conference Board of Canada.
De la Feria, R. 2020. “Tax Fraud and Selective Law Enforcement.” Journal of Law and Society 47(2): 240-270.
Department of Finance. 2020a. Supporting Canadians and Fighting COVID-19: Fall Economic Statement 2020. Ottawa, ON: Government of Canada.
_________. 2020b. Report on Federal Tax Expenditures: Concepts, Estimates and Evaluations 2020. Ottawa, ON: Government of Canada.
_________. 2020c. Fiscal Reference Tables 2020. Ottawa, ON: Government of Canada.
European Commission. 2018a. “Fiscalis Tax Gap Group Project – CIT Gap Estimation Methodologies.” Working Group ‘Structure of the Tax Systems.’ Brussels: EC. June.
_________. 2018b. The Concept of Tax Gaps: Corporate Income Tax Gap Estimation Methodologies. Taxation Papers, Working Paper No. 73. Brussels: EC. July.
Gendron, P.-P. 2012. “Canada’s GST at 21: A Tax Expenditure View of Reform.” World Journal of VAT/GST Law 1(2): 125-148.
Gendron, P.-P., and R.M. Bird. 2020. “VAT Gaps in Developing Countries: Measurement, Administration, and Politics.” SSRN Working Paper ID 3696578.
HM Revenue & Customs (HMRC). 2020a. Measuring Tax Gaps 2020 Edition: Tax Gap Estimates for 2018 to 2019. London: U.K. Government.
_________. 2020b. Measuring Tax Gaps 2020 Edition: Methodological Annex. London: U.K. Government.
Hodgson, G., and P. van Dijk. 2020. “Developing a Public Debt Management Plan.” C.D. Howe Institute Intelligence Memo. Toronto: C.D. Howe Institute. July.
Hutton, E. 2017. The Revenue Administration – Gap Analysis Program: Model and Methodology for Value-Added Tax Gap Estimation. Technical Notes and Manuals, Fiscal Affairs Department. Washington, D.C.: IMF.
Keen, M. 2020. “The VAT: An Overview of Developments and Issues.” The VAT Experience: What Have We Learned in the last 20 Years? VAT Webinar Series, Fiscal Affairs Department, International Monetary Fund. September.
Klassen, K., and N. Pantaleo. 2020. “Assessing the Canada Revenue Agency: Evidence on Tax Auditors’ Incentives and Assessments.” E-Brief 306. Toronto: C.D. Howe Institute. September.
Lester, J. 2019. “Finances of the Nation: Tax Expenditures in Canada – Historical Estimates and Analysis.” Canadian Tax Journal 67(3): 755-773.
OECD. 2019. Tax Administration 2019: Comparative Information on OECD and Other Advanced and Emerging Economies. Paris: OECD.
Radio Canada Info. 2019. L’écart fiscal des entreprises pourrait atteindre 11,4 milliards, estime Ottawa. CBC, June 18. (accessed on May 2, 2020).
Reckon LLP. 2009. “Study to Quantify and Analyse the VAT Gap in the EU-25 Member States.” London: Reckon.
Sarin, N., and L. Summers. 2019. “Shrinking the Tax Gap: Approaches and Revenue Potential.” NBER Working Paper 26475. Cambridge, MA: National Bureau of Economic Research.
_________. 2020. “Understanding the Revenue Potential of Compliance Investment.” NBER Working Paper 27571. Cambridge, MA: National Bureau of Economic Research.
Smart, M. 2014. “Departures from Neutrality in Canada’s Goods and Services Tax,” In After Twenty Years: The Future of the Goods and Services Tax. Toronto: Canadian Tax Foundation, 81-114.
________. 2020. “Debt in the Time of COVID-19: Forecasts and Policy Implications.” Perspectives on Tax Law & Policy. 1(3). September, Canadian Tax Foundation Online.
Thackray, M., and J. Ueda. 2014. Report of the Findings from the Revenue Administration Gap Analysis Program – The Value-Added Tax Gap in Estonia. Technical Assistance Report, Fiscal Affairs Department. Washington, D.C.: IMF.
US Congressional Budget Office. 2020. Trends in the Internal Revenue Service’s Funding and Enforcement. Washington, D.C.: Congress of the United States.
US Internal Revenue Service. 2019. Federal Tax Compliance Research: Tax Gap Estimates for Tax Years 2011-2013. Publication 1415, Catalog Number 10263H. Washington, D.C.: US Department of the Treasury.
van Dijk, P., and G. Hodgson. 2020. “How to Pay for the COVID-19-Induced Federal Debt?” Intelligence Memo. Toronto: C.D. Howe Institute. July.
This E-Brief is a publication of the C.D. Howe Institute.
Pierre-Pascal Gendron is Professor & Program Coordinator - International Business, Faculty of Business and International Development Institute, Humber Institute of Technology & Advanced Learning, Toronto, Canada.
Richard M. Bird is Professor of Economics Emeritus, Rotman School of Management, and Senior Fellow of the Institute on Municipal Finance & Governance, Munk School of Global Affairs & Public Policy, University of Toronto.