





Study In Brief
The Canadian Institute for Health Information’s annual National Health Expenditure (NHEX) is a vital source of data on how much Canadians and their governments are spending on healthcare generally, as well as on specific categories. Because the NHEX reports give both preliminary numbers based on government projections and revised numbers for past years based on actual spending, they also shed light on governments’ ability to hit their healthcare spending targets.
Comparing the preliminary and later numbers in successive NHEX reports over two decades shows that provincial and territorial governments have tended to overshoot their healthcare budget targets by 0.9 percent annually. Spending on drugs, miscellaneous services and capital in particular has tended to overshoot. With growth in Canada’s gross domestic product and governments’ tax bases likely to average 3.5 percent to 3.8 percent in the coming years, overshoots of 0.9 percent annually are material to judgments about the fiscal sustainability of publicly funded healthcare.
At the same time, the variation in experience in different categories of spending and across jurisdictions gives grounds for optimism about the future. During the 2014-2018 period, which featured the historically typical average 0.9 percent annual overshoot across the country, the majority of jurisdictions undershot their public health budgets, six undershot their hospital budgets, five undershot their budgets for other institutions and for administration, and four undershot their budgets for physicians and for drugs. New Brunswick and Manitoba undershot over the entire period, and Newfoundland and Labrador also stood out as a province that budgeted for, and achieved, modest growth in healthcare spending.
This variation across the country suggests that provinces and territories can learn from others’ experience when it comes to holding the line on spending, generally, and shifting care to more cost-effective channels. Every lesson in holding the line on healthcare spending matters. Budgeting sustainable increases in healthcare spending is helpful, but only if actual spending reflects those targets will publicly funded healthcare stay in line with Canadians’ long-term capacity to pay for it.
Introduction
Healthcare is the biggest budget item for Canada’s provincial and territorial governments. If government spending on healthcare consistently grows faster than Canada’s economy, as it has in the past, it will put chronic pressure on other programs and on taxes.
The Canadian Institute for Health Information’s (CIHI) annual NHEX report is a unique compilation of the sources and applications of funds used to promote, maintain and restore Canadians’ health. Along with illuminating detail on public and private sector spending on various institutions and services related to healthcare, the NHEX reports have a feature that sheds light on governments’ ability to hit their healthcare spending targets. Each year’s report shows preliminary numbers for healthcare spending by provincial and territorial governments for that year. These numbers reflect governments’ plans: they are projections derived from government budgets and estimates, and from Statistics Canada’s annual Capital and Repair Expenditures Survey. Each NHEX report also shows revised numbers for previous years, based on actual expenses. The differences between the preliminary and the later numbers provide insight into how reliable budget projections are – and, to the extent they are not reliable, provide clues as to which jurisdictions and categories of spending are facing the toughest challenges.
This Commentary reviews provincial and territorial governments’ healthcare spending from the first NHEX report in 1998 to the latest report in 2019. Reports covering the 2014-2018 period – a time when healthcare spending growth accelerated again, after a 2011-to-2013 reassuring series of spending increases lower than Canada’s potential economic growth rate. Over the 21 years for which NHEX reports allow comparisons of preliminary to later numbers, the differences between them – interpretable as indicating gaps between budget targets and results – have averaged 0.9 percent annually. Over the five years from 2014 to 2018, the average overshoot was the same: 0.9 percent annually. Overshoots that large – across the country, on average over time – affect judgments about the fiscal sustainability of publicly funded healthcare. For example, the 2019 NHEX report showed a preliminary number for growth of provincial and territorial governments’ healthcare spending of 3.7 percent. That number is close to most estimates of potential GDP growth. However, if the 0.9-percent average overshoot typical of past experience holds true, actual 2019 growth will turn out to be 4.6 percent. That is faster than the economy can grow over the long term. Sustained over time, that growth rate threatens some combination of rising taxes, more borrowing and squeezes on other government programs.
A look across jurisdictions and uses of healthcare funds between 2014 and 2018 reveals remarkable heterogeneity of experience and some clues about how to ensure that healthcare is fiscally sustainable. Most provinces budgeted modest increases in hospital spending during this period, and actual increases were more modest yet, resulting in large dollar savings. Budgeted increases in spending on other institutions and on physicians were also modest and largely achieved. Spending on drugs, public health and administration proved harder to control on average, but many jurisdictions came in under their budget targets in some or all of them.
The general conclusion of this survey is a cautionary one. Most governments try to hold healthcare spending in line. But actual increases in provincial and territorial healthcare spending tend to be larger than they budget. Capital spending is a particular challenge: from 2014 to 2018, preliminary numbers showed sizable declines, but later numbers showed increases, making for an average national overshoot close to 12 percent. Overall, the differences between plans and results revealed in successive NHEX reports show that overshoots in healthcare spending are a chronic problem.
More optimistically, the differences across jurisdictions and spending categories show that there is nothing inevitable in these overshoots. During the 2014-2018 period, when the average annual overshoot across the country was 0.9 percentage points, Newfoundland and Labrador’s later numbers came in exactly in line with the 2 percent average growth rate in its preliminary numbers, and New Brunswick and Manitoba’s later numbers showed slower growth than their preliminary numbers. Provincial and territorial governments are making constant efforts to provide better healthcare in more cost-effective ways, and subnational jurisdiction over healthcare means that each can experiment and learn from its own and others’ successes and failures. The provinces and territories that have had challenges meeting their budget targets in particular areas should pay particular attention to neighbours who have had greater success. To quote a famous, if fictitious, guru: “There is no try.”1 The long-term sustainability of healthcare in Canada depends not on what governments predict, but on what they actually do.
Why the NHEX Numbers Matter
CIHI’s annual NHEX report is required reading for people interested in Canadian healthcare, including the officials who help run and fund its publicly funded components. Particularly interesting are the NHEX’s data tables, which aggregate and break down spending by source and use of funds across Canada, and provide useful analysis of spending by use of funds per person and over time.
In order to provide timely data, the annual NHEX report includes numbers for that year’s provincial and territorial government healthcare spending. The report identifies these numbers as preliminary: CIHI derives them mainly from government budgets and estimates, since actual numbers are not available until after year-end. The following year’s report contains revised numbers for the previous year, and the years thereafter show final numbers, though revisions for numbers more than two years old do sometimes occur.
The timeliness of these preliminary numbers in the NHEX comes at a cost. As past C.D. Howe Institute reports have documented, and as the 2019 NHEX report warns, the CIHI projections tend to understate the spending that will actually occur.2 The preliminary NHEX estimates from 2012 to 2015 (the light blue bars in Figure 1) and accompanying commentary about slowing growth appeared to assuage concerns that healthcare budgets would relentlessly squeeze government budgets. However, subsequent NHEX reports with later numbers for those same years (the gold bars in Figure 1) revealed faster growth in spending than the preliminary numbers. Worse, the preliminary figures in those subsequent reports also showed a pickup in planned spending growth. Therefore, it is too early to conclude that publicly funded healthcare in Canada is fiscally sustainable.
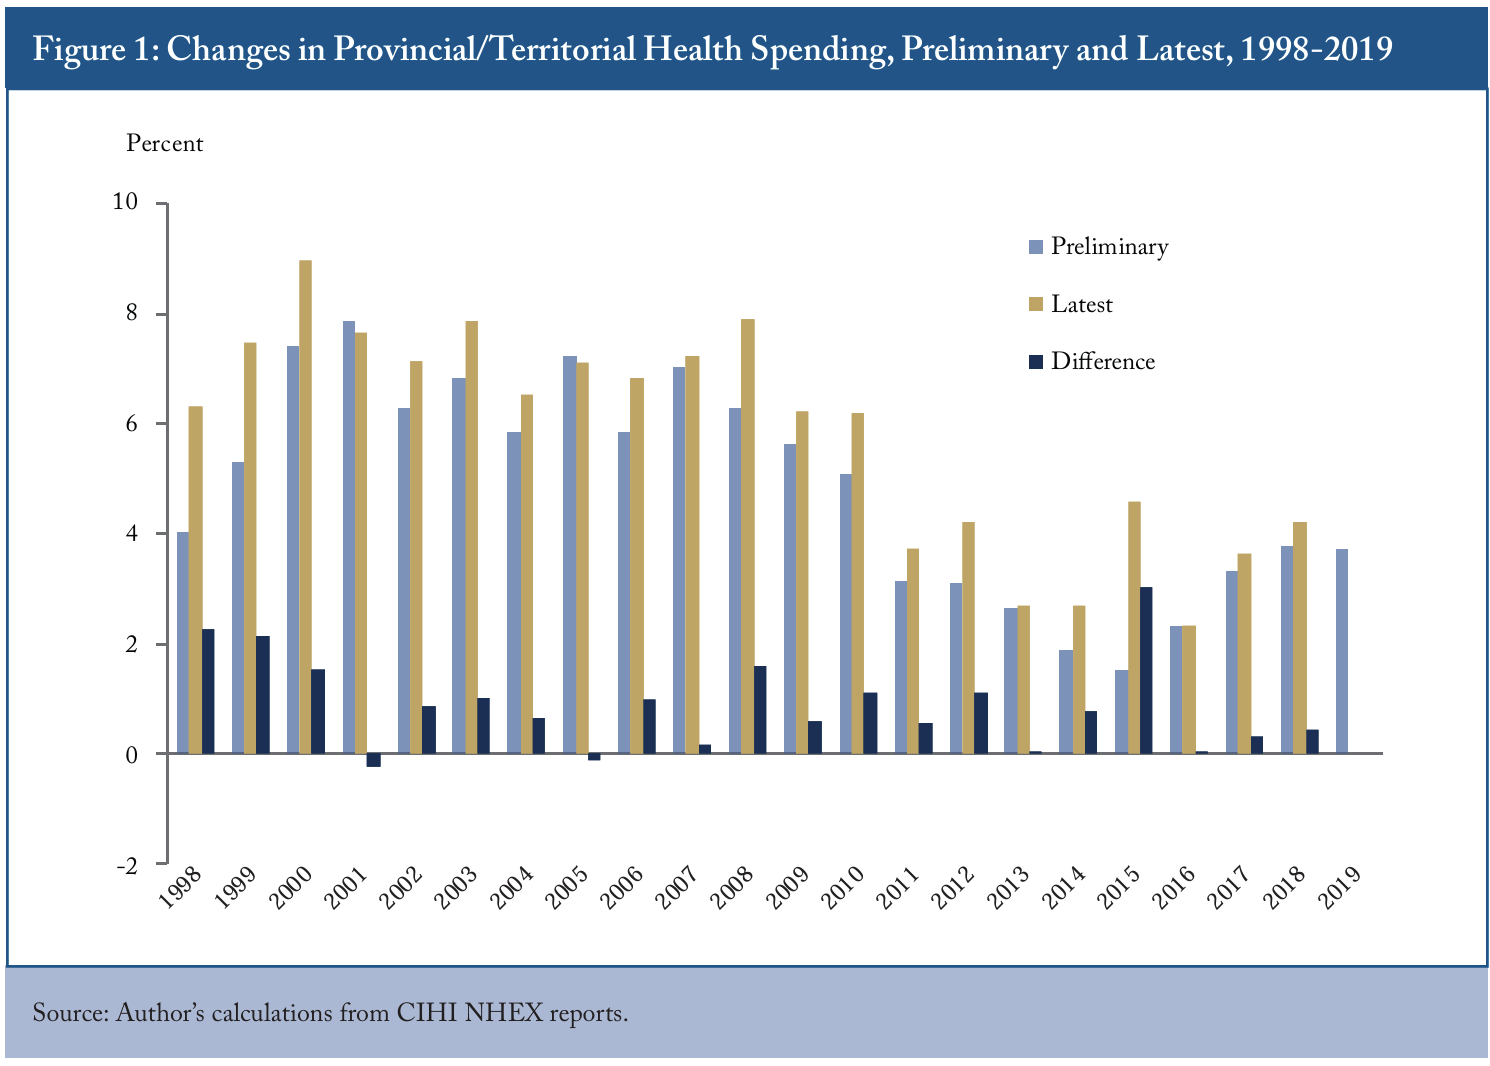
The fact that the NHEX provides both preliminary figures based on budgets and later figures based on actual spending also creates an opportunity. We can compare successive reports to look for illuminating patterns. When it comes to overall sustainability, we can compare the preliminary numbers in each report since the first one in 1998 with the latest numbers for those same years in the 2019 report, as Figure 1 does.
These latest numbers confirm that healthcare spending by provincial and territorial governments has grown more slowly since 2010 than it did previously. But they also reveal that the preliminary numbers exaggerated the improvement around middecade – just as they have typically prefigured slower growth than actually occurred ever since 1998. Since 2014, the later numbers have, on average, shown growth rates 0.9 percent faster than the preliminary ones (the dark blue bars in the Figure show the differences between the preliminary and the revised numbers). As it happens, the same gap between preliminary and later numbers has prevailed over the entire period for which the NHEX reports allow this comparison.
An overshoot of 0.9 percent in one province or territory in one year would matter for that jurisdiction, but would hardly be national news. Overshoots that big across the country, year after year, however, are an entirely different matter. They compound: If governments had actually spent what their preliminary numbers indicated every year since 1998, the 2019 preliminary figures would be one-fifth – some $34 billion – lower than they were.13 The 2019 NHEX report’s preliminary numbers put provincial and territorial health spending for that year at $166 billion. But if the growth rates shown in the preliminary numbers between 1998 and 2018 had been borne out, the preliminary 2019 figure would have been only 79.4 percent of that amount: $131.9 billion, or $34.1 billion lower. Calculating a cumulative overshoot by compounding the annual revisions is reasonable since each year’s growth rate starts from a fresh baseline – annual amounts that reflect all prior over- and undershoots. One caveat: the first revisions in each NHEX report – which provide the previous year’s figure from which the growth rates for the then-current year are calculated – are based on incomplete data and have themselves tended to be slightly lower than in later NHEX reports. The resulting lower baseline for each report’s preliminary growth rates for the then-current year exaggerates those rates – which, in turn, reduces the gap between the preliminary growth rates and the ones based on final numbers. This report uses the yearto-year growth rates because they are easier to explain and for readers to verify. However, over the 1998-2017 period the growth rates shown in first revisions were, on average, 0.15 percent lower than the growth rates shown in the later numbers, which suggests that comparing annual growth rates understates the total overshoot by about that amount. And they affect judgments about fiscal sustainability.
As is well known, Canada’s aging population is adding to the demand for health services. Less noted is that population aging is also shrinking the relative size of the workforce, slowing growth in GDP and the tax base. These two forces – one pushing spending up, the other pushing revenue down – represent a formidable squeeze on government budgets over the coming decades (Busby, Robson, and Jacobs 2014).
Growth of the working-age population will likely slow from an annual rate above 1 percent over the past three decades to a rate closer to 0.5 percent over the next three (Mahboubi 2019). If output per worker were to rise at its historical rate of 1.3 percent, that slower rate of workforce growth would produce real GDP growth around 1.8 percent annually.
But slower workforce growth might reduce capital accumulation. Standard ways of thinking about capital accumulation, based on national saving rates or ratios of capital to output and workforce, would suggest less help for output from capital investment in the future than Canada enjoyed in the past. If slower capital accumulation reduced the growth rate of output per worker to, say, 1 percent, annual real GDP growth would be around 1.5 percent. Adding the Bank of Canada’s 2 percent inflation target to those real growth rates would increase annual nominal GDP growth to the 3.5 percent-to-3.8 percent range in the coming decades.
The NHEX’s preliminary 2019 estimate of 3.7 percent healthcare spending growth is within that range and prefigures longer-term sustainability. However, if later revisions add 0.9 percent to it, concerns about the longer-term sustainability of publicly funded healthcare in Canada become more acute again.
Experience by Jurisdiction
What has happened since the reassuring trend ended in 2013? We can get some insights by looking at the differences between preliminary and later numbers by province and territory between 2014 and 2018. Figure 2 presents 2014–2018 averages of preliminary figures (light blue bars), revised figures (gold bars) and the difference between them (dark blue bars) for each jurisdiction. While overshoots are more common than undershoots, they are not universal, and their size varies markedly.
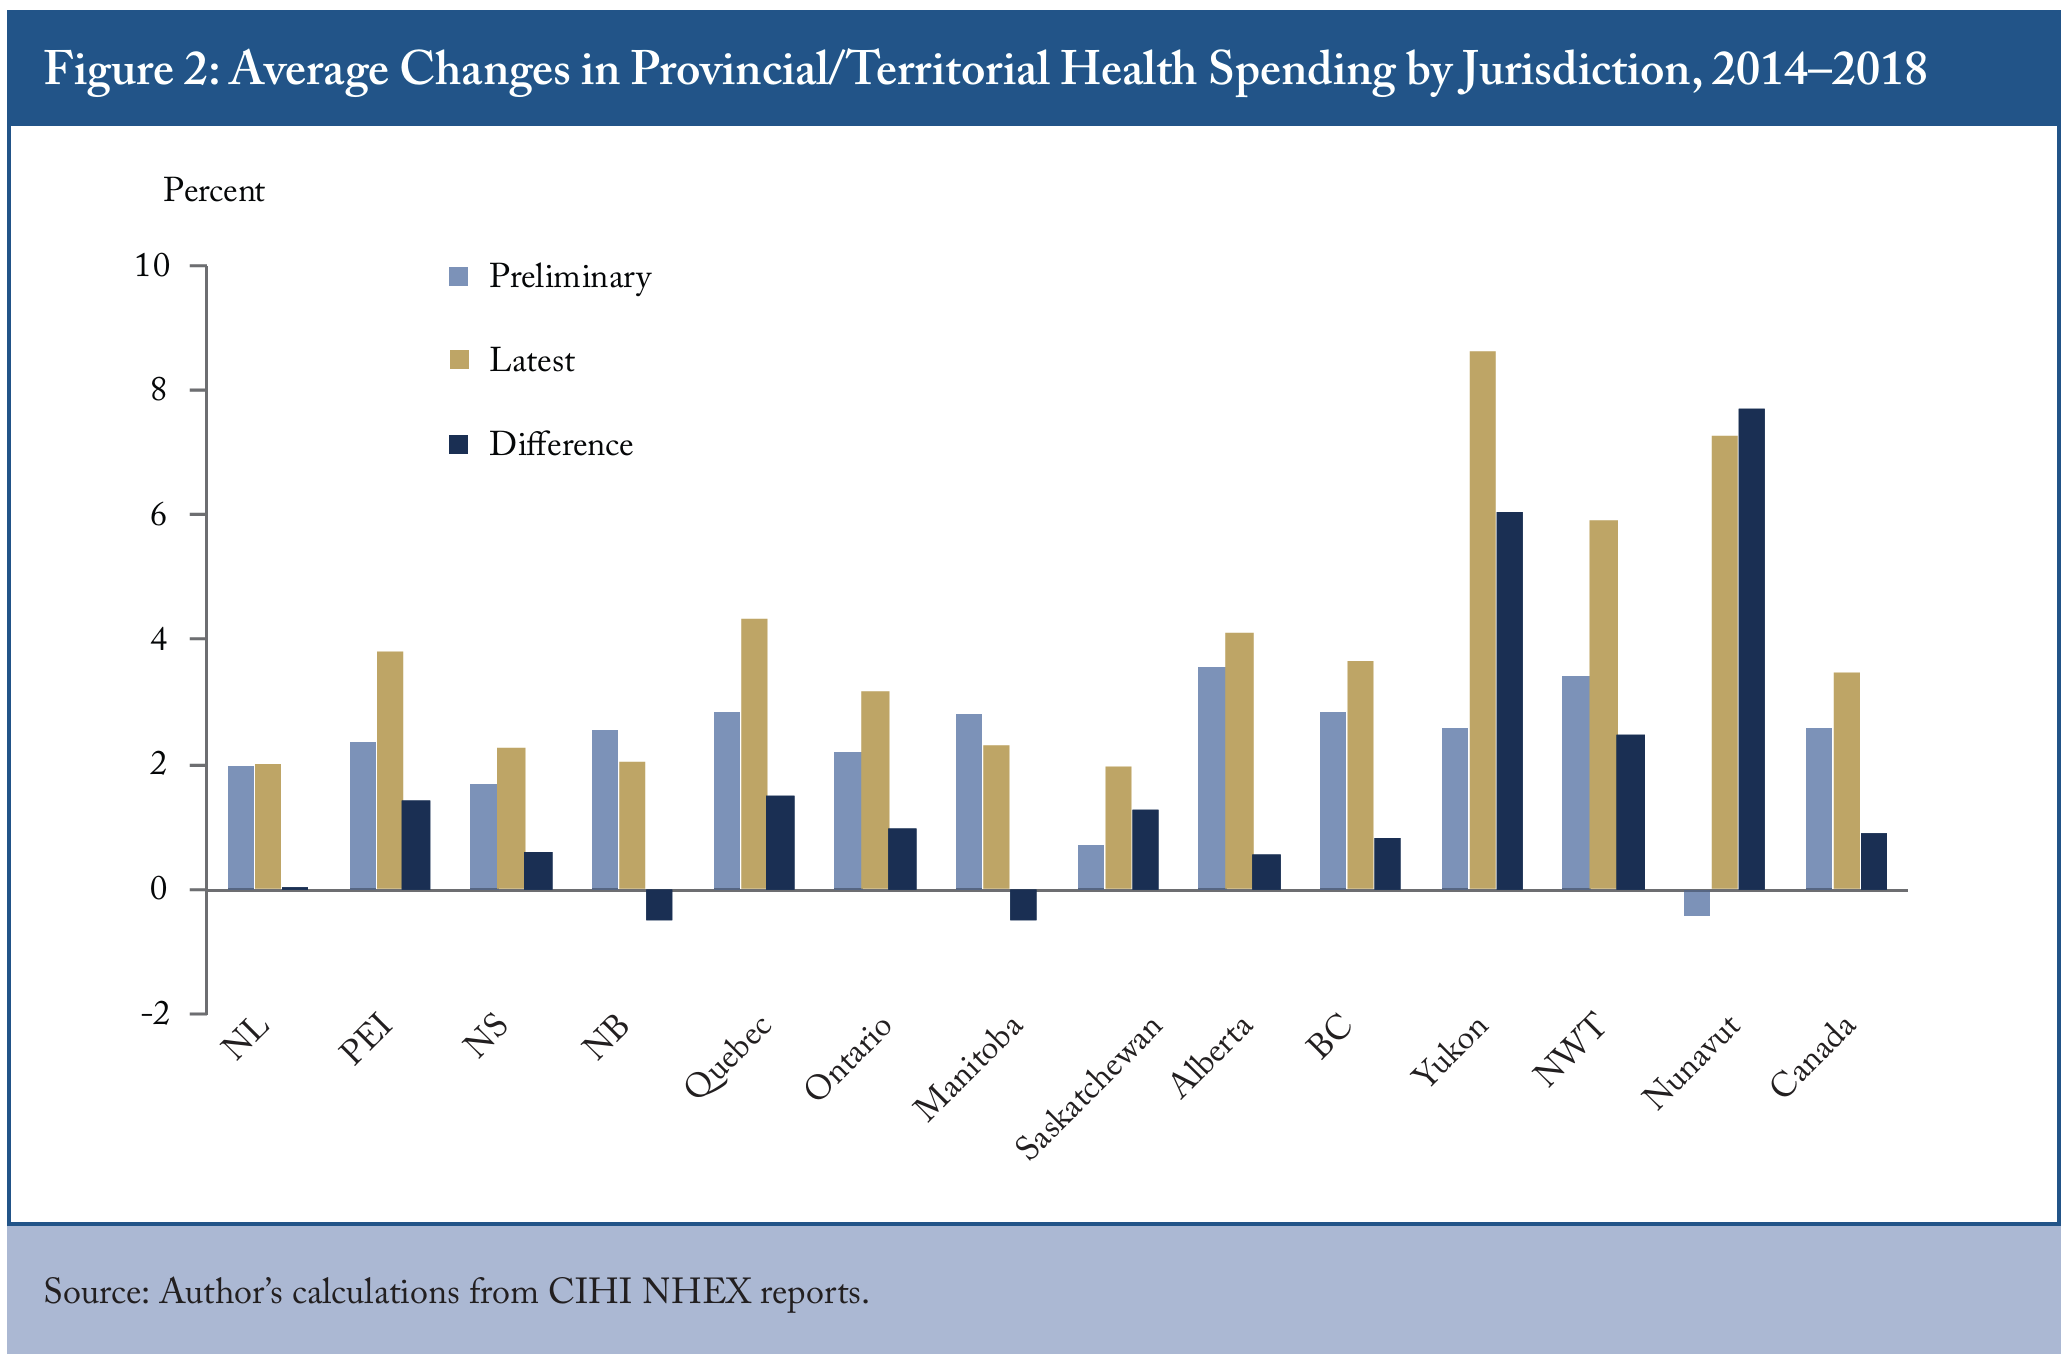
The Atlantic region demonstrated relative frugality in budgeting and in outcomes. The preliminary numbers for Newfoundland and Labrador, Prince Edward Island, Nova Scotia and New Brunswick prefigured healthcare spending increases of about 2 percent, and the later numbers largely bear the preliminary ones out. The Atlantic provinces are all conscious of demographic pressure and have historically had relatively weak fiscal positions, both of which may have encouraged cautious budgeting and relatively tight management of expenses.
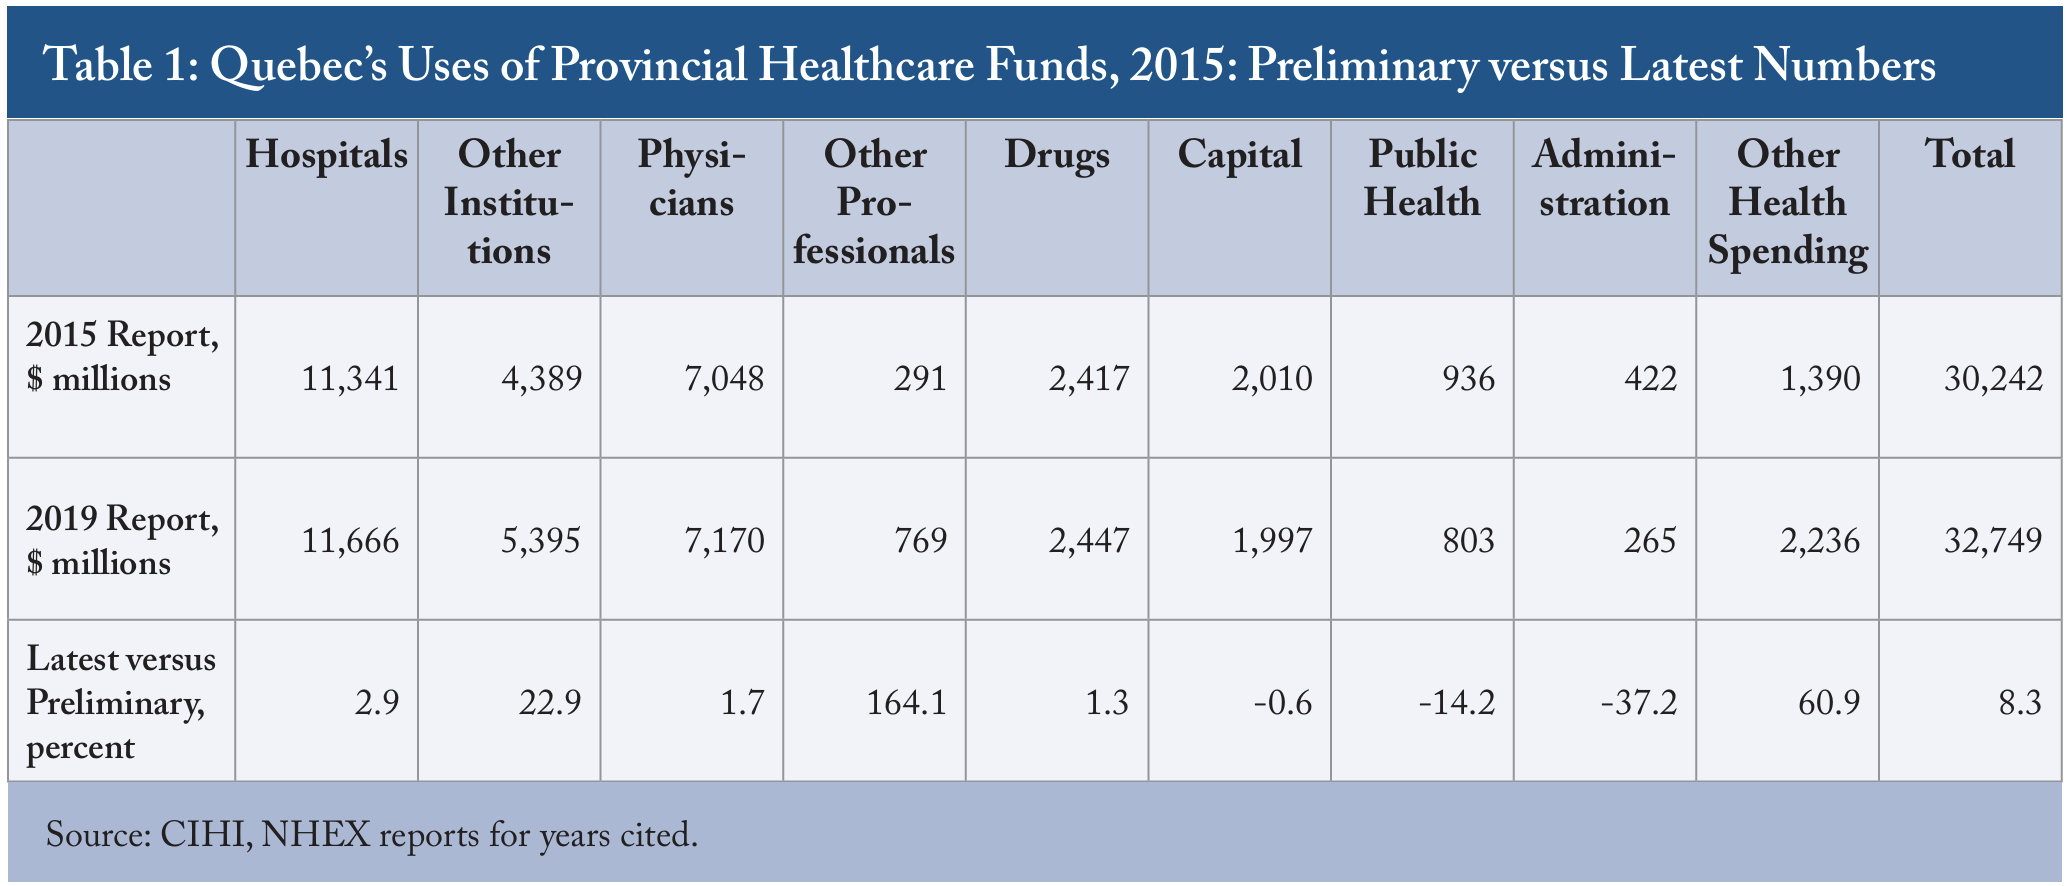
Quebec’s experience is harder to discuss because of a discontinuity in the province’s data. In four of the five years from 2014 to 2018, Quebec’s latest numbers show growth rates lower than prefigured by the preliminary numbers in those years’ reports. In 2015, however, the preliminary figures showed a meagre 0.5 percent increase and the latest figures show a startling 9.8 percent increase. This large overshoot, which puts average growth rates over the entire period higher than prefigured in the preliminary numbers, coincides with reclassifications of spending within Quebec’s health budget between 2015 and 2016. Quebec undertook a major reorganization of provincial health and social services delivery in 2015/16, and the 2016 NHEX report contained no numbers on Quebec’s use of funds in 2015 and 2016. Comparing the latest numbers (in the 2019 NHEX report) on Quebec’s health spending by use of funds – the subject of the next section below – to the breakdown in the 2015 report shows expenditures that are so much larger in some categories and so much smaller in others that forecasting mistakes alone cannot account for them (Table 1). The overshoot also likely reflects some reclassifications of spending from other parts of Quebec’s budget to health.24 The methodology notes for the 2019 NHEX (CIHI 2019b) provide more detail on the Quebec changes.
Ontario’s preliminary numbers prefigured modest increases from 2014 to 2018, while the latest ones show increases averaging 1.0 percent higher. The provincial government’s borrowing was a high-profile concern over this period, which led the government to forecast modest expenditure growth overall – restraint that, at least in healthcare, proved hard to achieve.
In Saskatchewan, the preliminary numbers showed such slow growth in health spending that even the latest growth rates of 2 percent register as a 1.3 percent average overshoot over the period. The other western provinces showed faster preliminary growth. Manitoba bucked the national tendency to overshoot: the growth rates in its latest numbers are lower than the growth rates in its preliminary ones. In Alberta and British Columbia, however, the latest numbers show that health spending grew faster than anticipated.
As for the territories, Nunavut’s preliminary numbers showed a decline over this period, unlike Yukon and the Northwest Territories where the preliminary numbers showed substantial increases. In all three territories, however, the latest numbers show increases considerably larger than prefigured by the preliminary ones. The territories face particularly tough combinations of rising expectations and challenges serving populations that are often remote and have acute healthcare needs. They may also feel less pressure to manage their costs sustainably than the provinces because, being wards of the federal government, they have a higher expectation of a federal bailout if they get into severe fiscal trouble.
Experience by Use of Funds
A look at various uses of health-related funds provides a second angle on differences between preliminary and later spending growth rates. Figure 3 presents 2014–2018 averages of preliminary growth rates (light blue bars), revised growth rates (gold bars) and the differences between them (dark blue bars) for the major spending categories in the NHEX reports. These averages exclude Quebec because the reclassifications of its spending after 2015 were so large that they would distort the national totals. Being calculated from dollar amounts, the growth rates in Figure 3 mainly reflect the experience of the other larger provinces.
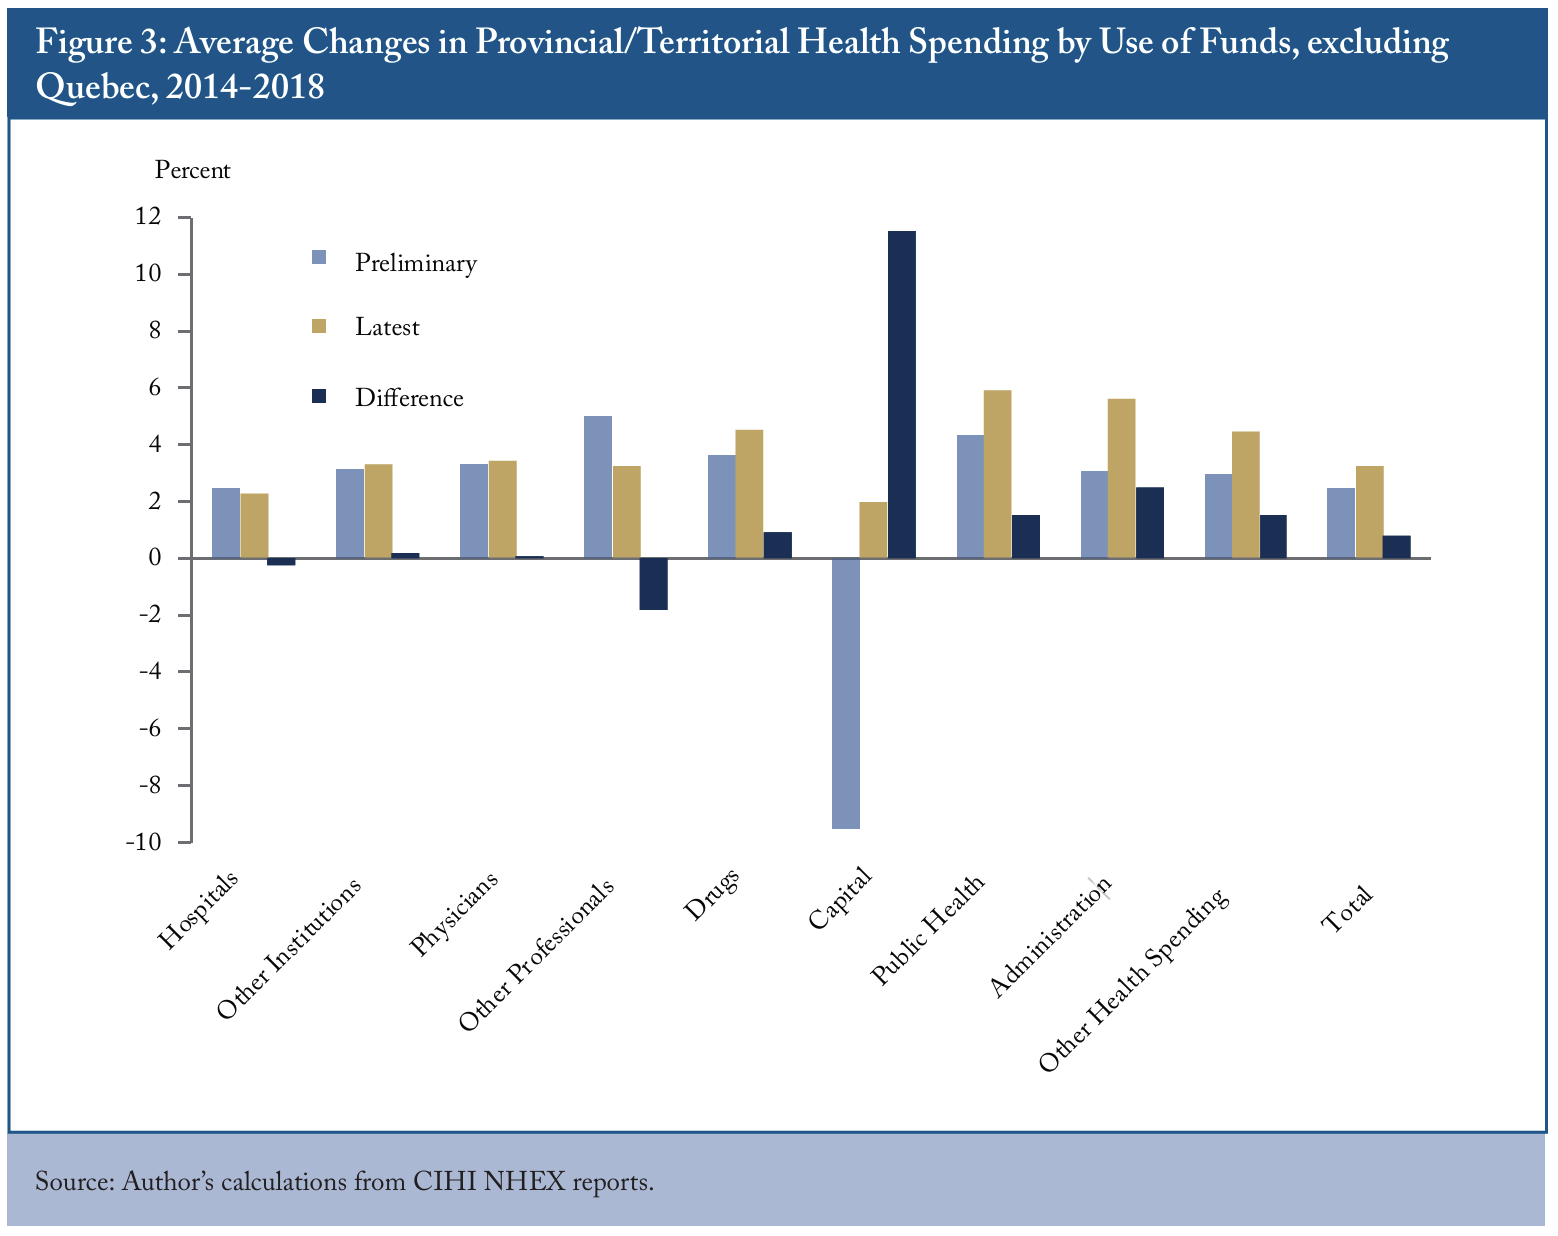
The growth rates and the contrasts between the preliminary and later numbers for hospitals, other institutions and for physicians show nothing remarkable – unless, in the larger context of the trouble containing spending, the achievement of planned modest growth on physicians and an undershoot in the case of hospitals seems remarkable. The “other professionals” category – including providers of dental, vision and chiropractic services, massage therapists, osteopaths, physiotherapists, nurses and psychologists – stands out because preliminary numbers indicated it would grow relatively rapidly but it did not, which may reflect challenges in diverting patients to nonphysician providers.
Drugs is a category where preliminary numbers prefigured relatively rapid growth and later numbers showed an overshoot. This period saw some increases in publicly funded drug coverage and continued growth in the number of conditions for which drugs are judged a suitable treatment, potentially resulting not just in better outcomes for patients but savings elsewhere. Drugs are also a healthcare spending category in which a relatively small proportion of beneficiaries account for a high proportion of the total, a phenomenon that may have become more pronounced during this 20142018 period.35 Looking at changes from 2016 to 2017 alone, CIHI (2018) notes that the share of publicly funded drug programs for beneficiaries who received $10,000 or more increased from 2.1 percent to 2.3 percent, while the share of spending on those beneficiaries increased from 34.5 percent to 36.6 percent.
Capital spending seems the worst area for actual government performance vis-a-vis budget projections. The preliminary numbers prefigured sizable declines in spending on average over the 2014-2018 period; the latest ones show modest increases, and the gap between them sticks out as a massive overshoot. The NHEX relies on Statistics Canada’s Capital and Repair Expenditure Survey for these numbers. They may not yield very different results than provincial and territorial estimates since the Statistics Canada survey responses likely reflect those estimates. However, it does mean that the NHEX reports present cash outlays for capital, rather than amortization – the consumption of capital already invested – which is the modern way of accounting for public-sector capital spending. Because many capital projects – building hospitals or other facilities, for example – involve large intermittent outlays and are subject to construction and other delays, one would expect this to be a relatively volatile category. It is possible that the tendency for preliminary numbers to show unrealized declines reflects provinces anticipating project completions that end up running over schedule. However, such large discrepancies in fiveyear average data suggest that capital projects are not only running over schedule, but also running over budget.
Moving to the right side of Figure 3, we see three categories – public health, administration and “other health spending”– in which the growth rates shown by later numbers consistently outpaced the preliminary ones. An optimist might see the overshoots in public health as indicative of governments responding in real time to the superior bang-per-buck available in this area; a pessimist would observe that the preliminary numbers already prefigured relatively rapid growth in this area and that the later ones suggest problems controlling it.
As for administration, cynics would see nothing surprising in it being an area where budgets anticipate much slower growth in spending than actually occurs. Meanwhile, “other health spending” is a heterogeneous category including research, home and community care, labour force training, ambulances and other transportation, medical devices and voluntary health associations. Without further breakdowns, it is hard to comment on possible causes of overshoots in these areas.
These categories of spending differ greatly in size. The preliminary 2019 NHEX figures show hospitals making up 36 percent of provincial/territorial healthrelated expenses and physicians 22 percent. The “other institutions category” makes up 12 percent, other health spending 9 percent, drugs 7 percent and public health 6 percent. At the other end of the scale, “other professionals” makes up about 1 percent of provincial/territorial government spending (most spending on these services is private) and administration also makes up about 1 percent. For a better sense of the fiscal importance of over- or undershoots in each, Figure 4 multiplies the average revisions over the 2014-2018 period by projected national spending in 2019 to produce their dollar equivalents for that year.
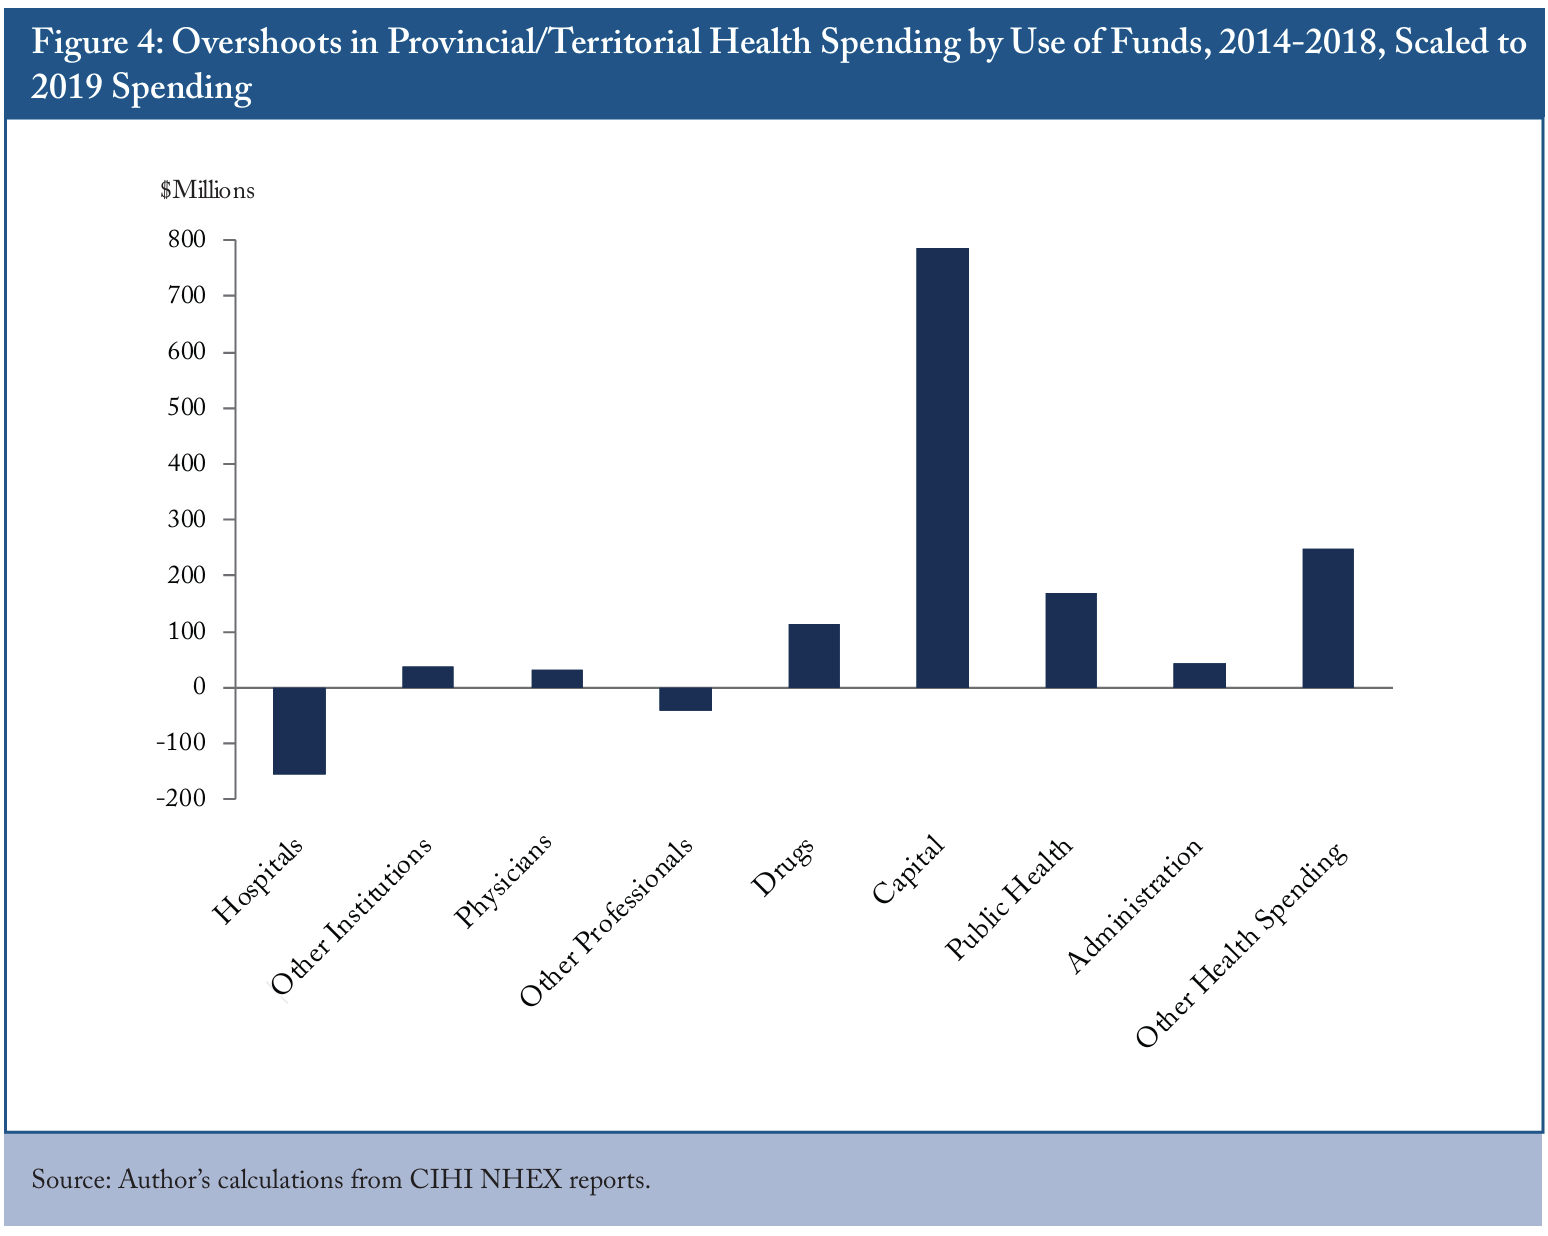
Spending on hospitals is so large that a marginal undershoot in percentage terms represents a significant dollar saving – $155 million – by the end of the five-year period. Drugs are still a relatively small share of total spending, but the overshoot in this category represents a significant dollar amount – $112 million. The overshoots in public health and other health spending were also large – about $170 million and $250 million respectively – even though they, too, are mid-range in the overall configuration of healthcare spending. Obtaining more detail in the “other” categories is an ongoing project at CIHI, and future NHEX reports may be able to shed more light on them. Not surprisingly, given the massive difference between preliminary numbers showing declines in capital spending and later ones showing increases, capital is an especially important category – an overshoot of about $790 million over five years – in understanding why later NHEX tallies show faster growth in healthcare spending than the preliminary ones.
Experience by Jurisdiction and Use of Funds
To summarize the experience across jurisdictions and use of funds at a glance, and its significance in the national picture, Table 2 presents the over- and undershoots for the 2014-2018 period for each jurisdiction and use. This table includes Quebec, with the caveat that in its case, some over- and undershoots reflect reclassifications.46 Because the 2016 NHEX report contained no numbers on Quebec’s use of funds in 2015 and 2016, I interpolated the Quebec numbers for those years, using the proportions in each category from the 2015 and 2017 reports and prorating to match the provincial totals. The colours reflect the differences between the preliminary and latest numbers: larger overshoots are deeper shades of blue, small differences are white and larger undershoots are deeper shades of gold. Within limits imposed by the need to make everything readable, the widths of the columns for the jurisdictions and the heights of the rows for the spending categories vary such that the size of each square roughly corresponds to its weight in the national result.
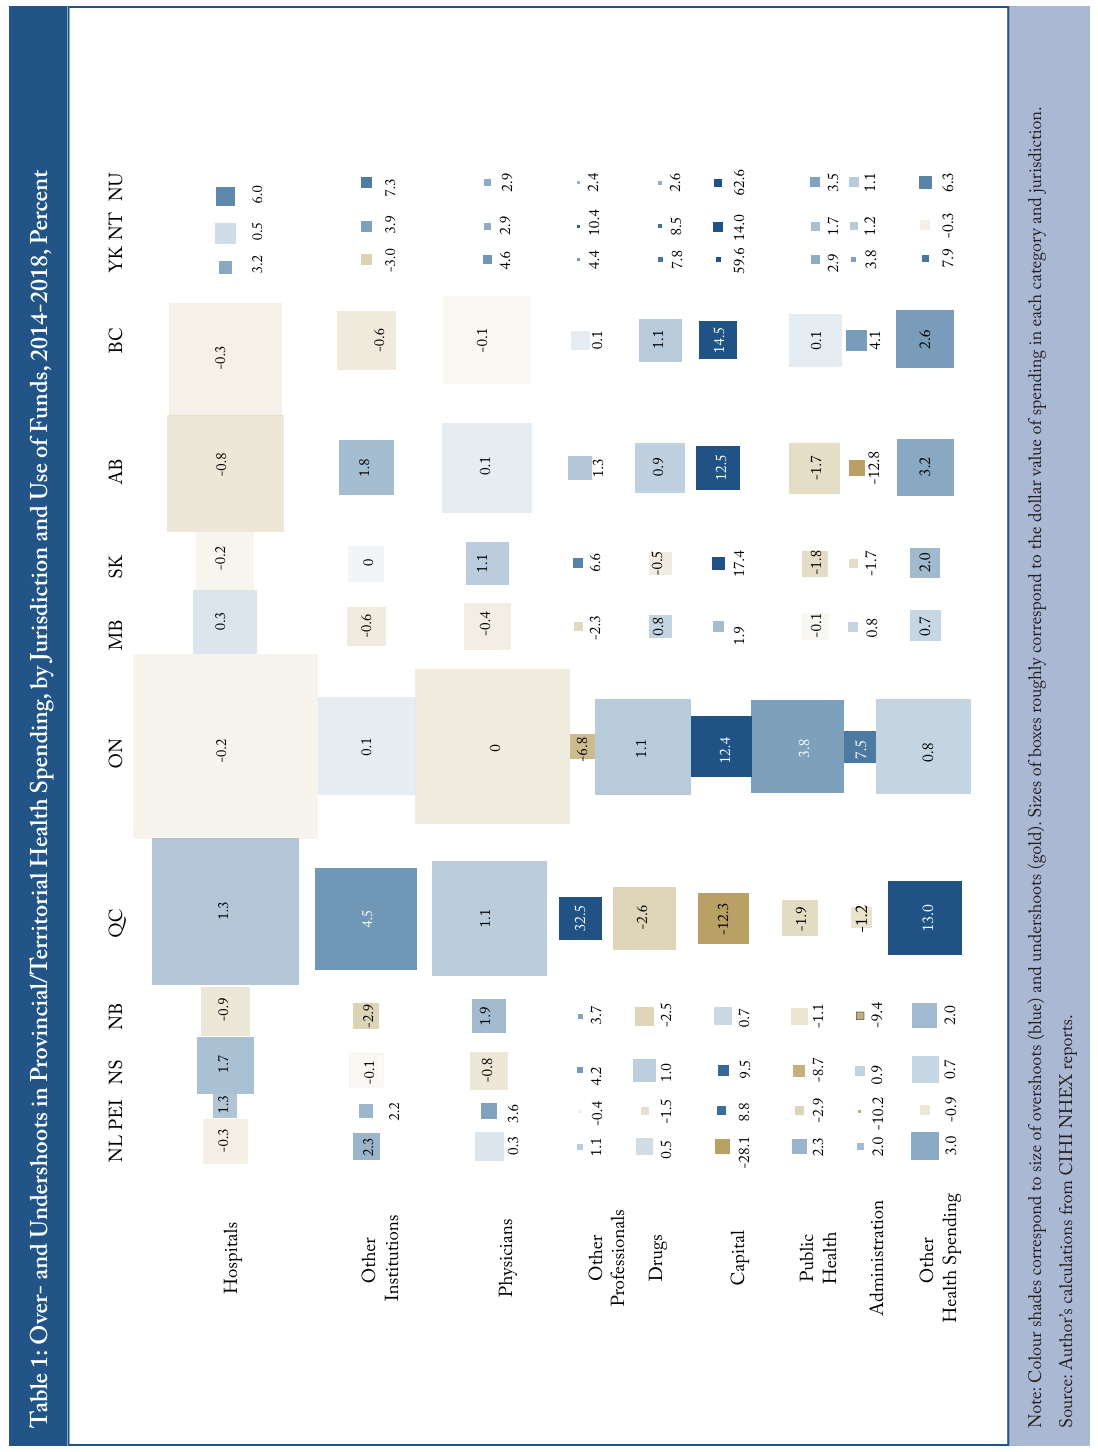
Table 2 highlights that the tendency for capital spending to come in above projections is a problem almost everywhere, and especially in the territories. “Other professionals” is a category distorted by the reclassifications in Quebec, where that square is a dark shade of blue, but it is a pressure point in many other jurisdictions. Experience with drug budgets varies considerably, with big overshoots evident only in the territories. The overshoot in administration seems to have been a problem particular to Ontario.
A striking feature of this presentation is the variation across categories. Even the rows with lots of blue also feature white and gold cells. On average, public health spending overshot across the country, but the majority – seven of the 13 provinces and territories – undershot in this category. Six jurisdictions undershot in hospitals, five in “other institutions” and in administration, and four in physicians and in drugs. One of the virtues of federalism, and of subnational jurisdiction over healthcare in particular, is the scope the provinces and territories have to experiment and learn from each other. Provinces and territories that have had problems controlling their healthcare budgets in specific areas have opportunities to learn from successes elsewhere – often from their immediate neighbours.
Conclusion: Keeping Actual Health Spending Sustainable
When it comes to the key questions of how quickly provincial and territorial health-related spending is growing, and whether long-term fiscal sustainability is a concern, the main conclusion of this review is a disappointing one. Governments tend to budget for smaller increases than they actually achieve. Forward-looking numbers tend to exaggerate the affordability of publicly funded healthcare: it is in the actual numbers that we need to see bending of the cost curve.
The tendency for actual spending to exceed planned spending means that the preliminary NHEX numbers have tended to understate actual increases, and the difference is material to judgments about fiscal sustainability. The warning in the 2019 NHEX about the tendency for the preliminary numbers to register lower growth rates than the later ones is serious. Users of the preliminary numbers need to be careful in drawing conclusions about sustainability, making comparisons among different jurisdictions or comparing numbers derived from different sources – as, for example, occurs when comparing privately and publicly funded services.57 The NHEX’s methods for producing preliminary numbers for workers’ compensation boards, municipal governments and the private sector rely on econometric techniques rather than budgets or other planning documents (CIHI 2019b). With proposals for expansions of public funding for drugs, perhaps including federally funded pharmacare, in the air, Canadians need to remember this government tendency to under-predict healthcare costs. Past experience gives ample grounds for thinking that actual costs of a new program will exceed what advocates initially promise.68 Robson (2018) argues that the claim by some pharmacare advocates that a new national formulary and insurance system will displace employer-sponsored drug plans for government employees, saving billions of dollars, is a fantasy.
More encouragingly, scans over time, across jurisdictions and by spending categories show considerable variation in outcomes. Indeed, categories such as public health, hospitals, other institutions, administration, physicians and drugs are all areas in which four or more provinces and territories achieved lower than preliminary spending numbers, on average over the 2014-2018 period. These variations give reason to hope that policy changes might make budget overshoots rarer and smaller in the future.
For one thing, the early 2010s saw smaller planned spending increases and smaller average overshoots across the country – the same pattern apparent in the Atlantic provinces later in the decade. Other C.D. Howe Institute research has shown that Canada’s provincial and territorial governments typically reaped revenues above their (likely conservative) budget projections over the period covered by the NHEX reports. It has also shown that total spending tended to come in above budget projections, with a suggestive correlation between the size and direction of the annual misses on either side of the budget (Robson and Omran 2019). Happily, this tendency has been less pronounced in more recent periods.79 Robson and Omran (2019) compare the correlations between in-year revenue and expense “surprises” among Canada’s senior governments over the past 18 years. Dividing the 18 years into three groups of six years, and comparing the correlation between the in-year surprises in the earliest and latest group, they find that the correlations fell in 10 of the 13 provinces and territories. While good countercyclical fiscal policy would produce negative correlations, which are rare, it is encouraging to see that the tendency for governments to spend unbudgeted revenues has declined. Fiscal discipline both in plans and execution can make a difference.
The importance of differing approaches across the country also deserves a final comment. Managing publicly funded healthcare is hard. Capital projects are notorious for running late and over budget. Provider groups are powerful. Consumers, who typically pay nothing or only a small portion of the cost of their services, are weak. Governments must innovate to better align the incentives of providers with the needs of patients, as well as with the imperatives of the taxpayers who fund the system. They need flexibility to experiment and to respond to what they learn from their own experiments and what has worked – or not worked – elsewhere. The federal government should not impede this flexibility, either in the areas now covered by the Canada Health Act, or potential new ones, notably pharmacare.
The key lesson from this comparison of NHEX preliminary and later numbers is that Canada’s provincial and territorial governments have a mixed record in achieving healthcare budget targets. On average, they have overshot them – and by amounts that threaten to translate fiscally sustainable intentions into fiscally unsustainable results. Trying is not enough. Amid the generally gloomy picture, recent over- and undershoots vary considerably by jurisdiction and by use of funds, and those variations may yield insights about translating “try” to “do.” More attention to the circumstances that have helped governments set and achieve sustainable increases can help keep the cost of publicly funded healthcare in line with Canadians’ capacity to pay for it.
References
Busby, Colin, William Robson, and Aaron Jacobs. 2014. “Managing the Cost of Healthcare for an Aging Population, 2014: Provincial Perspectives.” E-Brief. Toronto: C.D. Howe Institute. December. Available online at: https://www.cdhowe.org/publicpolicy-research/managing-cost-healthcare-agingpopulation-2014-provincial-perspectives.
Canadian Institute for Health Information. 2012. “Canada’s health care spending slows.” Ottawa.
__________. 2013. “Canada curbs health spending as expenditures reach $211B.” Ottawa.
__________. 2014. “Canada’s health spending hits slowest growth rate since 1997.” Ottawa. __________. 2015. “Canada’s slow health spending growth continues.” Ottawa.
__________. 2018. Prescribed Drug Spending in Canada, 2018: A Focus on Public Drug Programs. Ottawa.
__________. 1998-2019. “National Health Expenditure Database.” Ottawa.
__________. 2019. “National Health Expenditure Trends, 1975 to 2019 – Methodology Notes.” Ottawa.
Mahboubi, Parisa. 2019. Intergenerational Fairness: Will Our Kids Live Better than We Do? Commentary 529. Toronto: C.D. Howe Institute. January.
Robson, William. 2018. “Phantom Savings: Why National Pharmacare Will Not Displace Public Employee Drug Plans.” Intelligence Memo. Toronto: C.D. Howe Institute. August.
__________. 2019. “Healthcare Spending Overshoots a Threat to Sustainability.” E-Brief. Toronto: C.D. Howe Institute. April.
Robson, William, and Farah Omran. 2019. Big Spenders: Canada’s Senior Governments Have a Bad Budget Habit. Commentary 548. Toronto: C.D. Howe Institute. May.