
Study In Brief
- Inflation surged in most advanced economies in 2021 and 2022 before easing considerably in 2023. In Canada, the headline Consumer Price Index (CPI) rose 8.1 percent in the year ending June 2022, then declined to 2.8 percent by June 2023 – the most pronounced acceleration and deceleration in the pace of price changes in decades. Canada’s inflation experience is not unique: in the United States, consumer price growth peaked at 9.1 percent in June 2022, while the Euro Area peaked at 10.6 percent in October 2022.
- In this paper, we examine several key drivers of Canada’s recent decline in inflation. In particular, we measure product-level price changes and identify whether they are mainly supply-driven (i.e., energy prices, wages, or other input costs) or demand-driven (i.e., consumer expenditures, fiscal policy, and so on). We find most of the decline can be attributed to the falling price of energy, a product directly purchased by households and an input in the production of nearly all goods and services.
- Both supply- and demand-side factors have played a role, with a substantial reduction in demand-driven factors accounting for most of the overall fall in the pace of consumer price growth. Today, a greater portion of the remaining price pressures stem from supply-side factors, especially in housing and groceries. It may be necessary for the Bank of Canada to continue implementing a robust tightening of monetary policy to counteract the price pressure from the supply side.
The authors thank Jeremy Kronick, William B.P. Robson, Nicholas Dahir, Steve Ambler, Pierre Duguay, Paul Jenkins, David Laidler, Dave Longworth, Angelo Melino, John Murray and anonymous reviewers for comments on an earlier draft. The authors retain responsibility for any errors and the views expressed.
Introduction
Understanding recent developments is critical for fiscal and monetary policymakers, as well as for businesses and individuals navigating rapidly changing pressures. Both supply-driven and demand-driven factors contribute to the rise of inflation (Barnard and Koh 2023, Chen and Tombe 2023; Shapiro 2022). In this paper, we build on this recent literature and examine several key drivers of Canada’s recent decline in inflation. In particular, we measure product-level price changes and empirically identify whether they have been mainly supply driven (that is, by energy prices, wages or other input costs) or demand driven (by consumer expenditures, fiscal policy and so on).
This distinction between supply- and demand-driven price changes is critical, both to understand recent inflation dynamics and to guide policy decisions. The intuition is simple. Increases in demand can increase prices as consumers, businesses and governments compete for goods and services and suppliers expand output at potentially higher costs. Decreases in supply – that is, in the willingness of producers to sell at any given price – can also increase prices, especially if production costs rise. Monetary policy, among many other channels, can affect demand directly, since interest rates can influence consumer and business behaviour. Higher interest rates typically lead consumers to buy fewer durable goods, home renovations, travel services and many other items. Higher interest rates also raise the cost of capital for firms, so investment tends to fall. Monetary policy is therefore particularly well suited to address price increases that are due to rising demand.
Supply-driven price increases are more difficult and costly for central banks to address since they also tend to come with lower levels of economic activity. Raising interest rates, while still normally an appropriate response to rising inflation pressures, therefore further shrinks activity. Knowing the balance between supply- and demand-driven price increases therefore can inform policymakers about the relative costs of different policy responses to rising inflation. In addition, monitoring the ongoing balance between supply- and demand-driven price changes can provide a valuable signal about the effectiveness of monetary policy actions. Falling contributions from demand-driven price increases, for example, is evidence that interest-rate increases might be having the desired effect. In addition, since wages are an important cost of production for most goods and services, measuring whether price changes are supply-driven for labour-intensive items also provides evidence of whether recently high inflation is becoming more entrenched within expectations and, therefore, in wage settlements. We measure these changes with data through the second quarter of 2023.
While the future path of Canada’s inflation remains uncertain, this early analysis is nevertheless informative. We find that most of inflation’s recent fall is accounted for by energy prices. This is neither novel nor surprising, so we further estimate that, among core goods and services (which exclude food and energy), demand-side factors account for most of the drop, especially for goods that are sensitive to monetary policy. We find little evidence of wage-driven inflation.
Although encouraging, we also find increases in some supply-side prices have offset some of the gains from interest-sensitive items. Indeed, we find that most of the remaining price pressures in Canada are supply driven, although even these are concentrated among goods sensitive to monetary policy such as durable goods, vehicles, home renovations, and the like, and so could be compensated for through lower consumer demand. If such price pressures persist, monetary policy might need to tighten further. In both its June and July meetings, the Bank of Canada did just that. And although it paused in September and again in October, the Bank signalled that further increases might be required. Our analysis sheds important light on these recent trends, and could help guide policymakers’ future decisions.
Recent Trends in Canada’s Consumer Prices
Recent inflation data paint a mixed picture of progress. The significant decline in inflation from its peak of 8.1 percent in June 2022 can be attributed primarily to the decline in energy prices. The price of West Texas Intermediate, a key North American benchmark, declined from over US$120 per barrel in early June 2022 to less than US$70 one year later. Given the importance of energy both as a product directly purchased by households and as an input in the production of nearly all goods and services, this decline can have large implications for the CPI.
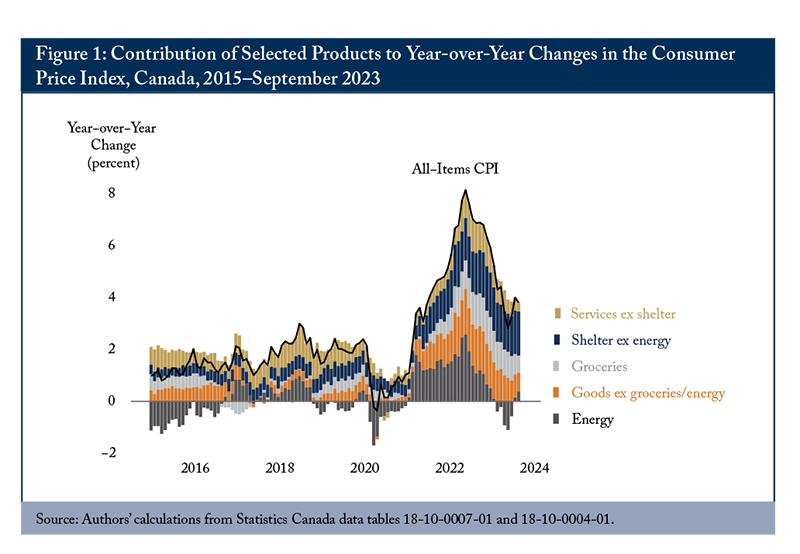
To quantify the direct contribution of individual items to changes in the aggregate consumer price index, we categorize all CPI products into five key product categories: energy, groceries, shelter (excluding energy), services (excluding shelter) and goods (excluding groceries and energy). Depending on the share of consumer expenditures allocated to purchasing items within each of these groups and the year-over-year changes in their prices, we calculate the contribution of each to changes in Canada’s headline CPI. The details are somewhat more complex, but this intuition suffices.
Before discussing the results of this simple decomposition, some caveats are in order. First, the year-over-year change in the CPI is simply one common and imperfect measure of inflation. But inflation is a distinct concept that, properly understood, relates to growth in the overall price level of an economy. Not all prices are incorporated into the CPI. And changes in the relative price of one item would, absent monetary policy accommodation, lead to offsetting changes in the relative price of other items over the medium to long run. But this process might take more than one year. Even if inflation is always and everywhere a monetary phenomenon – as economist Milton Friedman (1963) famously noted – movements in the CPI over the course of a single year need not be. All that being said, achieving a year-over-year change in the CPI of 2 percent is the official target of the Bank of Canada, so understanding the underlying components of this index is relevant.
With that intuition and those caveats in mind, we turn to our results. We illustrate the decomposition of CPI changes into certain selected aggregates in Figure 1. The most substantial contributor to the recent decline in the pace of CPI growth is clearly energy, in sharp contrast to its status as the leading contributor to inflation in the previous year. After contributing 2.6 percentage points to the CPI’s 8.1 percent rise at its peak in June 2022, this component turned negative from March 2023 onward. By July 2023, it accounted for –0.6 of a percentage point of the 3.3 percent annual change in the CPI that month, although it increased to positive by September following an increase in global oil prices. Despite this increase, energy contributed 2.2 percentage points to the overall 4.3 percentage point fall in the year-over-year change in Canada’s average consumer prices between June 2022 and September 2023. That is, the direct effect of lower energy prices accounts for just over half of Canada’s overall drop. This is large.
The contribution from other categories, such as food, shelter and services excluding shelter, can be similarly estimated. We find that services excluding shelter contributed 0.3 of a percentage point to the overall 3.8 percent growth in the CPI for the year ending September 2023, while shelter costs excluding energy contributed 1.7 percentage points. These contributions represent a slight decrease from June 2022, when services excluding shelter and shelter costs excluding energy contributed 1.1 and 1.6 percentage points, respectively. The contribution from core goods also saw a decline, from 1.8 percentage points in June 2022 to 0.7 of a percentage point in September 2023. Despite these reductions, however, many of these categories are contributing more than their averages before the COVID-19 pandemic: shelter costs excluding energy are adding one percentage point more than their usual contribution; core goods contribute an additional 0.4 of a percentage point; and groceries an extra 0.5 of a percentage point. Only services excluding shelter are contributing less.
Although the changes in the contribution of shelter might appear minor, it is important to highlight that the underlying factors driving these changes have shifted considerably. Shelter accounts for over three-quarters of the rise in services inflation relative to pre-pandemic norms, and the price of owned accommodation is a particularly important factor. Initially, the primary factor behind the rising prices of owned accommodation was an increase in homeowners’ replacement costs, which represent the expenses associated with the depreciation of residential properties. Statistics Canada calculates this cost by taking a portion of the change in the house-only new home price index. With the average price of homes falling over the past year, the contribution of depreciation costs has fallen to near zero. At the same time, however, increases in interest rates by the Bank of Canada have increased mortgage interest costs significantly. These costs alone now contribute nearly a full percentage point to Canada’s overall annual rate of CPI growth. Falling depreciation costs and rising mortgage interest costs are offsetting one another.
Within core goods, price increases initially were dominated by higher costs of major durable goods such as new vehicles and household furnishings and equipment. These price increases are partially the result of supply-chain bottlenecks experienced globally following the recovery from the pandemic. Since summer 2022, the total contribution of vehicles and household furnishings and equipment has shrunk, although they still contributed together nearly 0.4 of a percentage point to overall core goods price changes in September 2023.
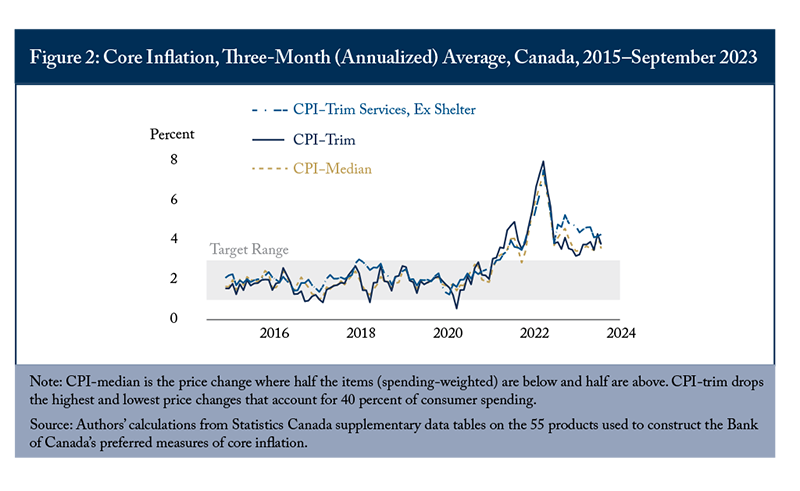
Although the pace of headline growth in the CPI has dropped significantly, there are sources of concern for the Bank of Canada. Over the past three months, for example, several measures of core inflation to which the Bank pays particularly close attention have remained relatively stable between 3.5 and 4 percent. We display three such measures in Figure 2. Two core measures, CPI-median and CPI-trim, look at eliminating volatile and outlier price changes by either focusing on the consumer-spending-weighted median price change across several product categories or dropping the top and bottom quintiles of changes. Indeed, these data potentially motivated public statements by the Bank, including by then deputy governor Paul Beaudry, who said that “the likelihood that total inflation could get stuck well above the two percent target has increased” (Beaudry 2023). At its June 2023 meeting, the Bank’s governing council was concerned that current monetary policy might not be sufficiently restrictive to bring inflation back down to target. The minutes of the meeting explicitly list several concerns, including the persistence of elevated core inflation, strong and broad consumer spending and the view that the economy “remained clearly in excess demand” (Bank of Canada 2023). They also noted that “the lags in the transmission of monetary policy may be longer than normal because of pent up demand for services and improvements in supply chains for goods.”
Decomposing the contribution of individual products to changes in the CPI is informative but merely an accounting exercise. We turn next to a potentially more informative examination of price changes.
Distinguishing Supply- from Demand-Driven Price Changes
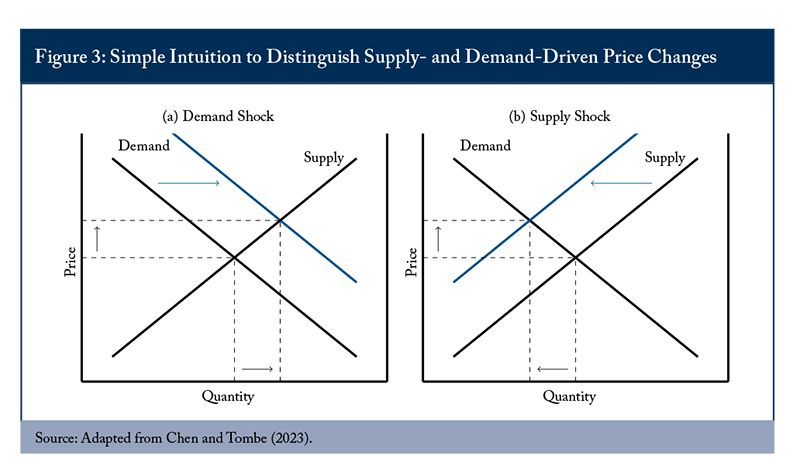
The intuitive distinction between supply- and demand-driven price changes is simple. In perfectly competitive markets, equilibrium prices are such that the quantity demanded by consumers aligns with the quantity supplied by producers. Furthermore, if we assume that demand curves slope downwards while supply curves slope upwards – that is, higher prices lead consumers to purchase less while higher prices lead producers to sell more – then the direction of changes in prices and quantities for a particular product indicates whether the change is dominated by supply-side factors or demand-side factors. Consider an example. When demand for a product increases, both its price and quantity will increase. Conversely, a negative supply shock, caused by, say, a rise in energy costs, increases price but decreases quantity. We illustrate this simple intuition in Figure 3.
Empirically, we use a technique known as Vector Autoregression (VAR). The VAR model allows us to identify unanticipated changes in price and quantity that deviate from trends observed in the past. The finer details of how the method is implemented can be found in our previously published research paper (Chen and Tombe 2023). Briefly, we focus on meaningfully large deviations, or “shocks,” in each item’s observed prices and quantities relative to a flexible trend. If the changes in price and quantity are in the same direction (that is, both up or both down), we categorize these changes as demand shocks. Conversely, if they are in opposite directions (one is up and the other is down), we categorize these as supply shocks. Small shocks (one-fifth of all observations) are ambiguous. To be clear, multiple types of shocks can and do affect prices and quantities for any given product. The method we use identifies whichever shock, whether demand or supply, is largest. It will also identify both positive and negative contributions to price changes at the individual product level, which we then aggregate into broader categories of supply- and demand-driven changes. We must also caution that we identify only the proximate shocks for any given product, not the ultimate one. That is, a demand shock in the United States for a good that Canada imports is identified by our method as a supply-driven shock, since the resulting price increase will be associated with a decrease in quantity demanded in Canada. It is, in a very real sense, a supply shock for Canada, but ultimately driven by an increase in US demand. We refer readers to Chen and Tombe (2023) for a thorough discussion of the methodological details.
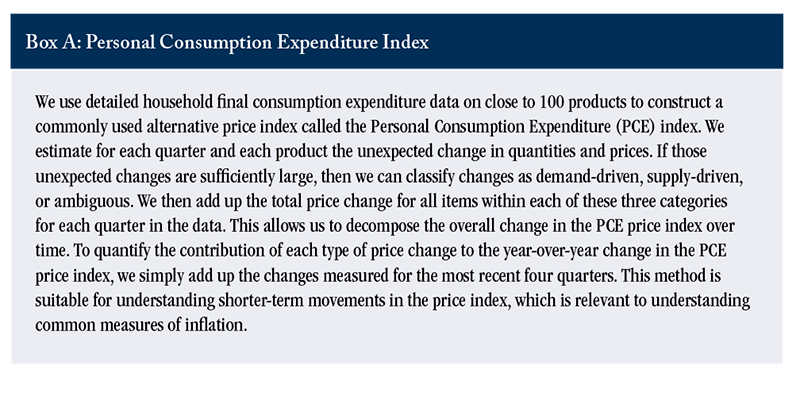
Our analysis draws upon the same detailed household final consumption expenditure data described earlier. This is a rich, quarterly database that monitors close to 100 products, detailing the prices and quantities consumed by households. Using these data, we construct a commonly used alternative price index called the Personal Consumption Expenditure (PCE).
The Contribution of Supply and Demand Factors
Overall, we find that, for the second quarter of 2023, supply-driven price increases accounted for 2.5 percentage points of the total 3.4 percent PCE price index growth during that period. We illustrate this in Figure 4, panel A. In contrast, demand-driven increases contributed only one percentage point. These are both higher than their respective pre-pandemic norms, with supply-driven price changes adding 1.8 percentage points more than their average contributions over the 2010–19 period. In contrast, demand-driven increases were only 0.5 of a percentage point above normal. In addition, we find these supply-driven changes are more persistent. Between the second quarter of 2022 and the second quarter of 2023, for example, the contribution from demand-driven price increases more than halved, falling by nearly 1.1 percentage points.
Supply-driven increases, meanwhile, saw their contribution decline by less than half that much – only 0.5 of a percentage point. Overall, compared with the second quarter of 2022, when inflation reached its highest level, the recent reduction in the contribution of lower demand-driven price increases accounts for nearly 40 percent of the 2.9 percentage point total decline in PCE price changes. Lower supply-driven price increases account for one-sixth of the decline.
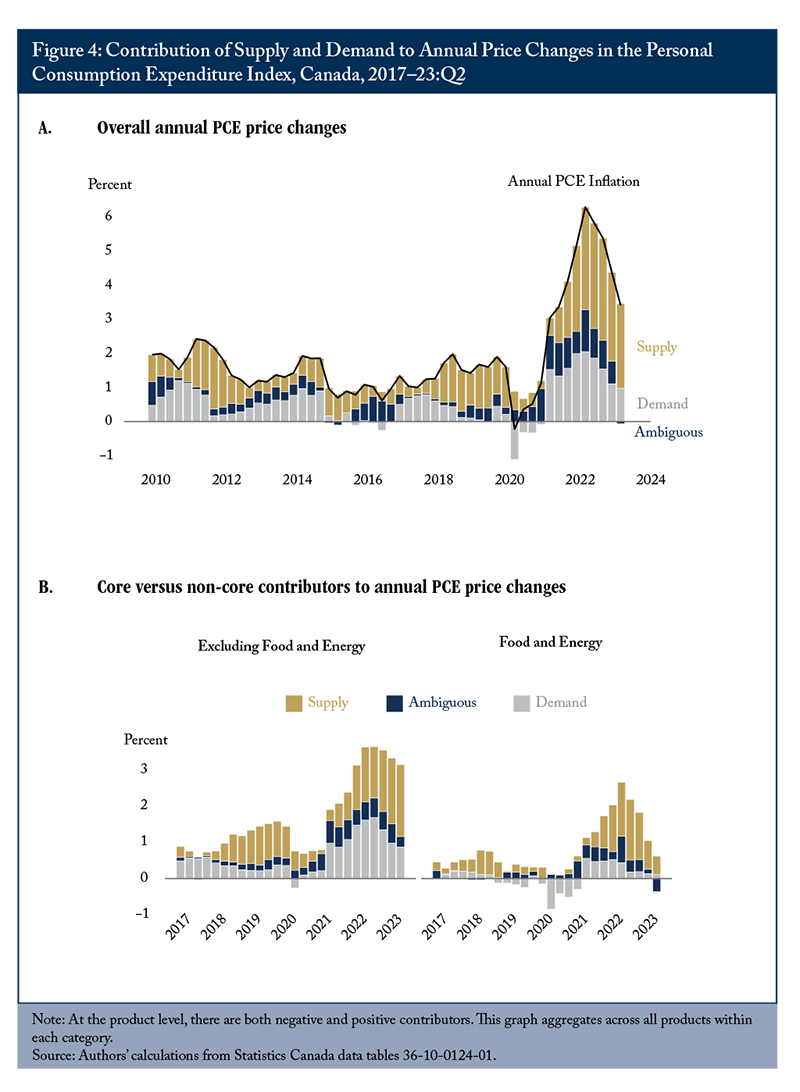
Given the importance of the various core measures of inflation (illustrated in Figure 1) for guiding monetary policy, we first separate price changes in food and energy products from changes in all other products. We illustrate the results in Figure 4, panel B. Here, demand-driven price increases in food and energy products fell to negligible levels by early 2023, with supply-side factors dominating. The decline since the second quarter of 2022 was largely supply driven, which accounted for one percentage point of the decline, while demand accounted for 0.3 of a percentage point. Ambiguous price changes accounted for the balance.
As recent Bank of Canada communications have noted, however, there are more concerning and persistent inflation pressures among core measures. To approximate the Bank’s core measures, we isolate items excluding food and energy. We find demand-driven price changes account for 0.9 of a percentage point of the increase in PCE inflation for the year to the second quarter of 2023, and supply-driven changes account for two percentage points. In terms of specific core products driving these results, we find rent and imputed rent for homeowners are the top supply-side contributors, accounting for a combined 1.1 percentage points of the total overall PCE price change in the second quarter of 2023. Excluding shelter, both supply- and demand-driven price changes contributed roughly similar mounts to core inflation in the latest quarter. On the demand side, food purchased from restaurants tops the list, accounting for 0.2 of a percentage point.
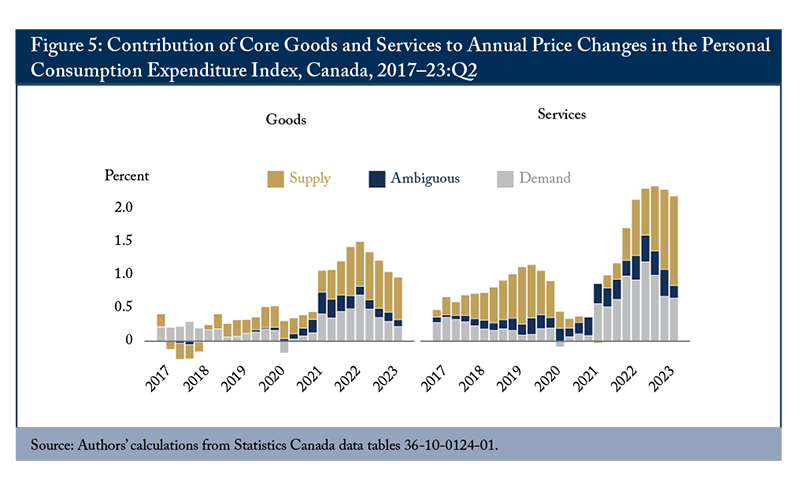
Among the core items, there are important differences between goods and services. We find that services are currently the most significant contributors to annual PCE inflation. In the second quarter of 2023, services contributed over two percentage points, while goods contributed one percentage point – see Figure 5. Importantly, supply-driven price increases are sizeable in both sectors and have been on the rise, particularly among core services. On a quarter-over-quarter basis, the contribution from demand appears to be negligible. It should be noted that the higher rate of price increases among service items is entirely due to shelter services, both paid rental fees and imputed rent for homeowners. When those two items are removed, goods and services each contributed the same to overall annual PCE inflation in the second quarter of 2023, but with demand-driven increases a more important contributor to changes in services prices than in goods prices.
Historically Sensitive versus Not Sensitive to Monetary Policy
There are early indications that monetary policy might be making a contribution to Canada’s declining inflation. As discussed previously, some items are sensitive to increases in the Bank of Canada’s policy rate, at least historically. To the extent that such rate increases lower consumer expenditures on those goods and services, either prices should decrease or the pace of price increases should moderate. Based on the estimates of Chernis and Luu (2018), we classify each product (excluding food and energy items) into those that are sensitive to monetary policy, those that are moderately sensitive and those that are not sensitive.
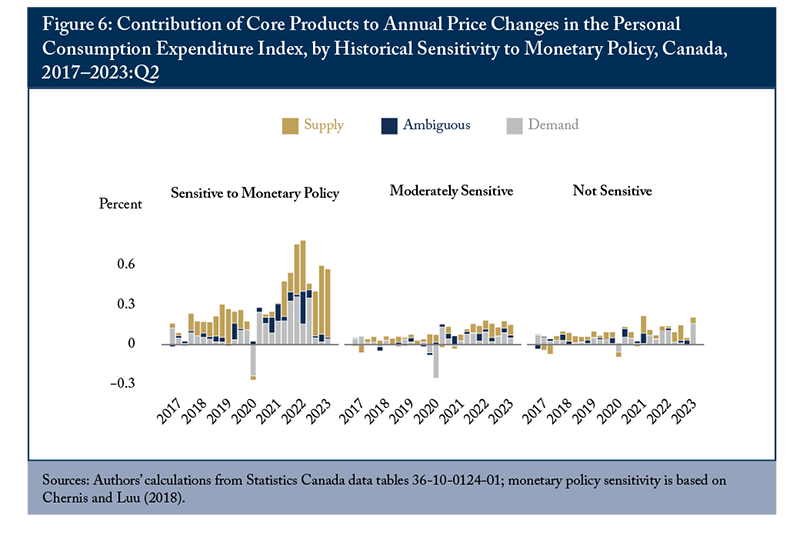
We estimate significant decreases in demand-driven price increases from the fourth quarter of 2022 onward among products sensitive to monetary policy. This is consistent with monetary policy’s having the desired effect. Several products experienced notable negative contributions to price changes that we attribute to demand-driven factors: telecommunication services, furniture and furnishings, home repairs and more. We observe little to no material change among items that are moderately sensitive or insensitive to monetary policy. However, despite this decrease in demand-side price changes among sensitive items, substantial contributions to price increases persist within this product category that are almost entirely due to supply-side factors – particularly apparent in housing (for both owners and renters), restaurants, new trucks and others. While demand-driven price increases have decreased considerably among products sensitive to monetary policy, supply-driven price pressures have continued. This trend suggests that supply-side factors – such as supply-chain disruptions, corporate pricing strategies and production costs – might have a greater influence on pricing in these sectors than does consumer demand. To be clear, this does not imply that the central bank should not continue to act. More tightening, or continuing with the currently elevated rates for longer, will decrease demand-driven changes further, and therefore could offset supply-driven increases overall, although potentially with higher economic consequences.
Labour Intensive versus Not Labour Intensive
As a final exercise, we examine the potential role of wages and labour costs in driving inflation changes. This is increasingly relevant, since, following the pandemic, the labour market in Canada has experienced historically tight conditions, with high job vacancies and low unemployment, leading to robust wage growth exceeding 5 percent from February to May 2023, and still sitting at 5 percent in September. With average hourly wage increases surpassing headline inflation, debate has intensified about the degree to which wages and labour costs have contributed to rising prices.
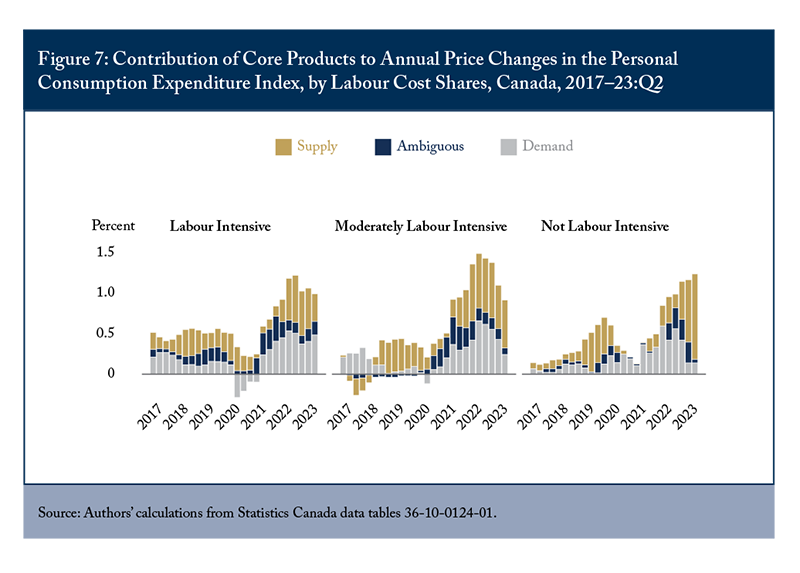
To shed light on this issue, we combine our household consumption data with information from Statistics Canada’s supply and use tables that contain information on labour input purchases by sector, which we map to products. We then categorize products based on their labour cost shares, distinguishing between labour-intensive and non-labour-intensive products. To the extent that wage pressures are driving price increases, our method would classify this as a supply-driven price increase, because higher wages shift the supply curve up and left, and therefore we predict such an effect would be larger among products with high labour-cost shares. We do not find this to be the case, as Figure 7 shows.
Among products classified as highly labour intensive – which we define as those in the top quartile of the distribution of labour-cost shares across products – we find that they contributed one percentage point to annual PCE price changes in the second quarter of 2023. Supply- and demand-driven price changes were almost equally influential in this group. If wage increases were a large contributor to rising inflation, then supply-driven price increases among labour-intensive products would be more pronounced. Indeed, the contribution of supply-driven increases is far lower than for products in the bottom quartile of labour intensity.
Overall, this suggests that wages and labour costs might not have been important contributors to either inflation’s rise or fall. One caveat concerns productivity. If labour productivity rises relatively more among products with high labour-cost shares, then the contribution of wage changes to prices would be dampened. But to the extent that this is not the case, these results suggest there is no evidence to support concerns about the imminent risk of a wage-price spiral. Of course, if inflation remains high, this result might change, which is why the central bank regularly emphasizes its goal of returning to target inflation rates.
Conclusion
The pace of consumer price growth has moderated in many economies since its peak last year, but the battle against inflationary pressures continues. In analyzing factors that have contributed to the recent fall of inflation in Canada, we find that most of the decline can be attributed to the fall in goods prices, with energy prices playing a prominent role. In the services sectors, however, shelter costs have been the main driver of persistent high costs. Both supply- and demand-side factors have played a role, with a substantial reduction in demand-driven factors accounting for most of the overall fall in the pace of growth of consumer prices. We find no evidence of the growing influence of labour costs on price increases and, encouragingly, we find modest evidence that higher interest rates have begun to reduce the pace of demand-side price increases among goods that are historically sensitive to monetary policy.
Today, a greater portion of the remaining price pressures stem from supply-side factors. It is important to note that monetary policies alone cannot address these supply-side pressures directly; instead, they work primarily by reducing the overall demand for goods, services and economic activities. Given the persistence of supply-side price pressures, the Bank of Canada should continue to implement a robust tightening of monetary policy to counteract the effects originating from the supply side and to preserve well-anchored inflation expectations. But this might come with a higher economic cost.
References
Bank of Canada. 2023. “Summary of Governing Council Deliberations: Fixed Announcement Date of June 7, 2023.” Available at: https://www.bankofcanada.ca/2023/06/summary-governing-council-deliberations-fixed-announcement-date-june-7-2023/.
Barnard, Geoff, and Seung-Hee Koh. 2023. “If It’s Not One Thing It’s Another: Supply and Demand Factors Driving Rising Inflation.” OECD Ecoscope, February 14. Available at: https://oecdecoscope.blog/2023/02/14/if-its-not-one-thing-its-another-supply-and-demand-factors-driving-rising-inflation/.
Beaudry, Paul. 2023. “Economic Progress Report: Are We Entering a New Era of Higher Interest Rates?” Speech, June 8. Available at: https://www.bankofcanada.ca/2023/06/entering-new-era-higher-interest-rates.
Chen, Sonja, and Trevor Tombe. 2023. “The Rise (and Fall?) of Inflation in Canada: A Detailed Analysis of Its Post-Pandemic Experience.” Canadian Public Policy 49 (2): 197–217.
Chernis, Tony, and Corinne Luu. 2018, “Disaggregating Household Sensitivity to Monetary Policy by Expenditure Category.” Bank of Canada Staff Analytical Note 2018-32. Ottawa: Bank of Canada.
Friedman, Milton. 1963. “Inflation: Causes and Consequences. First Lecture.” Repr. in Dollars and Deficits: Inflation, Monetary Policy and the Balance of Payments, 21–46. Englewood Cliffs, NJ: Prentice-Hall, 1968.
Shapiro, Adam. 2022. “A Simple Framework to Monitor Inflation.” Federal Reserve Bank of San Francisco Working Papers 2020–29.