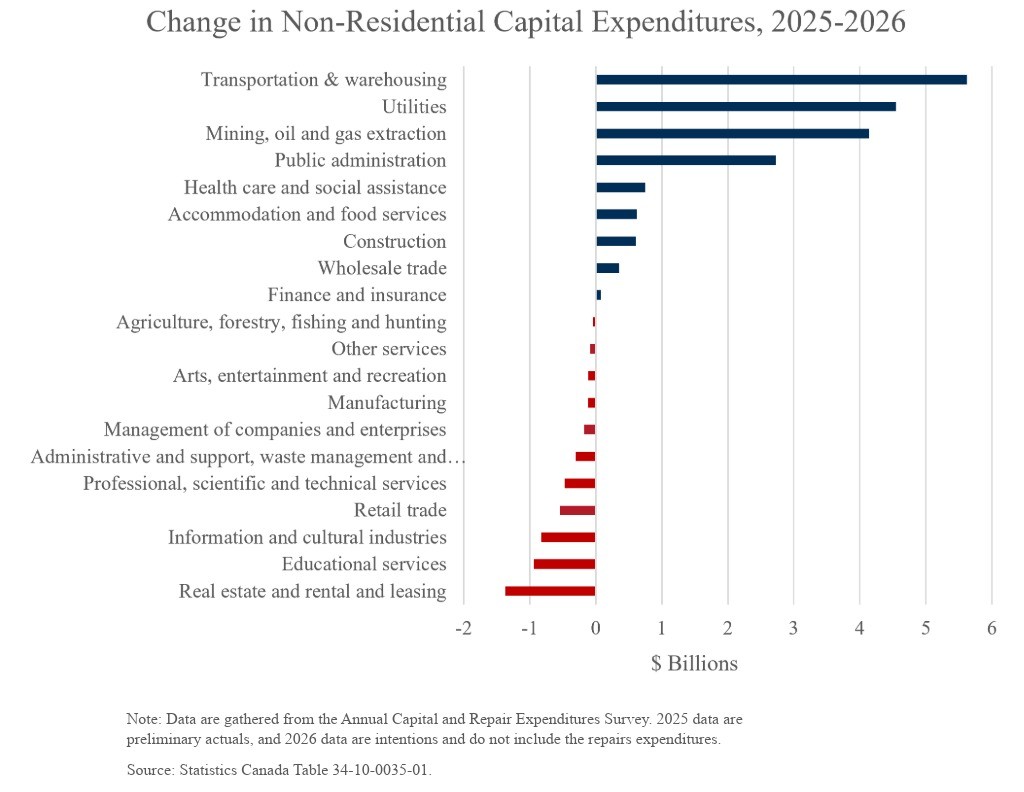
As tariffs push Canada to diversify its exports, transportation infrastructure is becoming a critical competitive advantage. Over the 12 months ending in May 2026, road transport carried 36 percent of Canada’s export value, more than any other mode. That dominance reflects the country’s deep reliance on the United States, the
Interested in becoming a Member of the C.D. Howe Institute? Please fill out the application form below and our team will be in touch with next steps. Note that Membership is subject to approval.
"*" indicates required fields
Member Login
Not a Member yet? Visit our Membership page to learn more and apply.