What are the odds of a rising debt ratio?
Next week’s federal budget will most likely showcase a long-run fiscal projection that shows debt on a strong downward trajectory. In the 2022 Fall Economic Statement, the federal government projected it would achieve positive net worth by 2055/56.
We came up with a more realistic outlook in our new C.D. Howe Institute E-Brief. It shows there is a material risk that the debt ratio will rise, rather than fall, from its level in 2027/28.
First, we incorporate a mild quarterly economic downturn for 2023 by adopting the economic statement’s downside scenario. We then add the impact of recently announced increases in the Canada Health Transfer, assume that overall program spending grows in line with GDP from 2028/29 to 2055/56, and that the average effective interest rate on debt will equal average growth over the long term. These changes from the budget’s long-term projection cause the 2055/56 debt-to-GDP to rise to 24.2 percent, a far cry from Ottawa’s projected negative 1.8-percent.
However, that is just the beginning of recognizing fiscal prudence.
Economic shocks are certain to interrupt growth over the projection period. That will result in temporary discretionary government spending to support incomes and the economy, putting upward pressure on debt. As explained in more detail in the paper and online appendix, we simulate 1,000 debt-ratio scenarios in which future recessions and government responses to them are similar to those faced faced over the prior 60 years.
We do not know when, how often, or how hard recessions will hit federal finances. Our simulations provide odds of various fiscal outcomes.
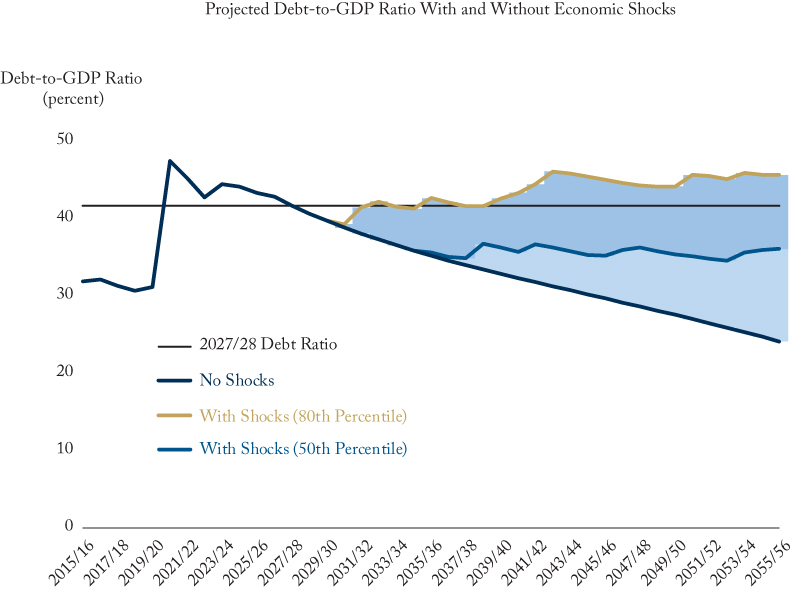
In this Figure, the straight dark blue line is the base-case scenario with no recessions over the next few decades. The light blue line represents the typical (50th percentile) debt ratio when we include the impact of recessions. The typical debt ratio averages about 36 percent, which is lower than in 2027/28 (dotted line). However, for most of the projection period, at least 20 percent of the simulations result in a debt ratio that is the same or higher than in 2027/28. (The gold line in the figure, which represents the 80th percentile of the simulations.) Starting in 2038/39, about 25 percent of the simulations show the debt ratio above its level in 2027/28 – there is a 1 in 4 chance that the debt ratio will exceed its starting value at some time over the projection period.
The International Monetary Fund deems a country’s debt sustainable with high probability if only 1 in 5 outcomes show debt ratios higher than their starting levels. To avoid exceeding that limit, the government would have to permanently increase revenue by the equivalent of almost one percentage point of GST or reduce spending by the same amount – roughly $10 billion – by 2027/28.