Ottawa Needs a New Approach to Fiscal Policy
The current federal fiscal framework is imprudent and unfair to future generations. A new approach to fiscal policy is needed.
 The government has demonstrated a bias for deficit financing. Budgets from 2016 to 2019 showed deficits throughout each five-year forecast horizon. A commitment to balancing the budget was made in 2016, but dropped in 2019 when a declining debt-to-GDP ratio became the fiscal anchor.
While incurring debt to finance measures to stabilize the economy during the pandemic was sound public policy, fairness requires that the government pay down the debt while the people benefiting from the spending are paying taxes.
However, this is not likely to occur under the current fiscal plan. Substantially more fiscal consolidation is required to pay down the debt within 20 years than shown in the current fiscal plan. Further, even achieving the less challenging objective of returning the debt ratio to its pre-pandemic level would require more fiscal consolidation than currently envisioned.
The federal government cannot credibly claim that its approach to fiscal policy is either prudent or fair. To achieve a better outcome, the government should surrender some of its fiscal policy flexibility. One approach would be to enshrine specific constraints in legislation, as is done in many other countries. This E-Brief argues that a better approach would be to legislate a set of guiding principles for fiscal policy while allowing a high degree of discretion in their application and requiring an independent assessment of compliance with the principles.
The Federal Government’s Bias in Favour of Deficit Financing
In the 2016 budget, the federal government projected ongoing deficits over the five-year forecast horizon, and justified the decision by pointing to favourable borrowing conditions. There was also a vague commitment to balance the budget, with a timeline to be set “when growth is forecast to remain on a sustainably higher track” (Canada 2016, 53). Multiyear deficits were also projected in the 2017, 2018, and 2019 budgets, but the commitment to balance the budget was abandoned despite a medium-term forecast of sustained growth and low unemployment. Ottawa’s fiscal anchor became a declining debt-to-GDP ratio.
The federal government discarded, with good reason, its fiscal anchor during the downturn induced by the COVID-19 pandemic, when policy measures costing about $350 billion were implemented to stabilize the economy and protect the health of Canadians. Since fiscal year 2020/21, however, the federal government has also debt-financed non-COVID-related policy initiatives costing about $250 billion by 2025/26, confirming its deficit bias. About half of the additional spending was announced in the 2021 budget, which stated, in an echo of the 2016 budget’s rationale for deficit financing, that, “In today’s low interest rate environment, not only can we afford these investments in Canada’s future, it would be short-sighted of us not to make them” (Canada 2021, 24).
We disagree. Adding $250 billion to the debt through discretionary policy measures while presiding over the massive increase in pandemic-related debt was irresponsible. It raised the risk that debt levels would become unsustainable at some point in the future. It was also poorly timed given the state of the economy. The 2021 budget presented evidence that the economy was “poised to come roaring back” (Canada 2021, 15), making the additional fiscal stimulus questionable. The case for subsequent increases, amounting to almost $100 billion, is even weaker. In the 2022 budget, the labour market was described as “exceptionally strong” (Canada 2022, 5). A more restrictive fiscal stance would have eased inflationary pressures, taking some of the strain off monetary policy. Finally, the additional debt-financed spending is unfair to future generations.
The 2021 budget set a new fiscal anchor: unwind COVID-related deficits and achieve a lower debt ratio over the medium term. Since Ottawa incurred deficits throughout the pre-pandemic period, this anchor does not commit the government to achieving a budget surplus. Nevertheless, the 2022 Fall Economic Statement shows a budget surplus by fiscal year 2027/28, and a declining debt ratio over the long-term forecast horizon.
A More Prudent Baseline Forecast Scenario
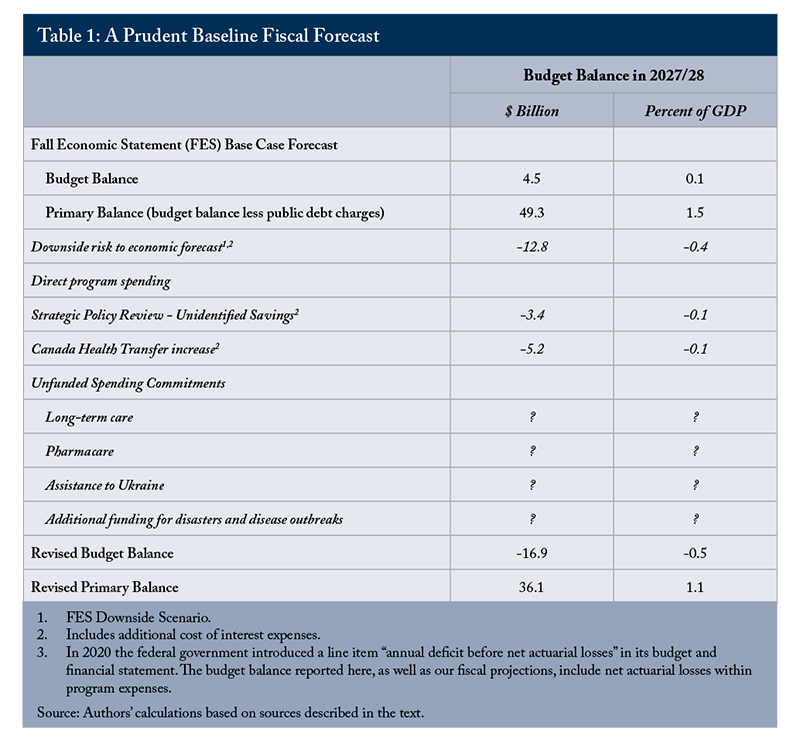
Finance Minister Chrystia Freeland describes the federal government’s fiscal framework as prudent. That characterization is difficult to justify, for several reasons:
- the risks to the base case economic forecast underlying the fiscal strategy are acknowledged as unbalanced, but no risk adjustment is made;
- expected savings from the Strategic Policy Review are included in the spending forecast before they have been identified; and
- the fiscal framework includes funding for anticipated spending pressures, but the amount set aside is insufficient to cover recently announced increases to the Canada Health Transfer.
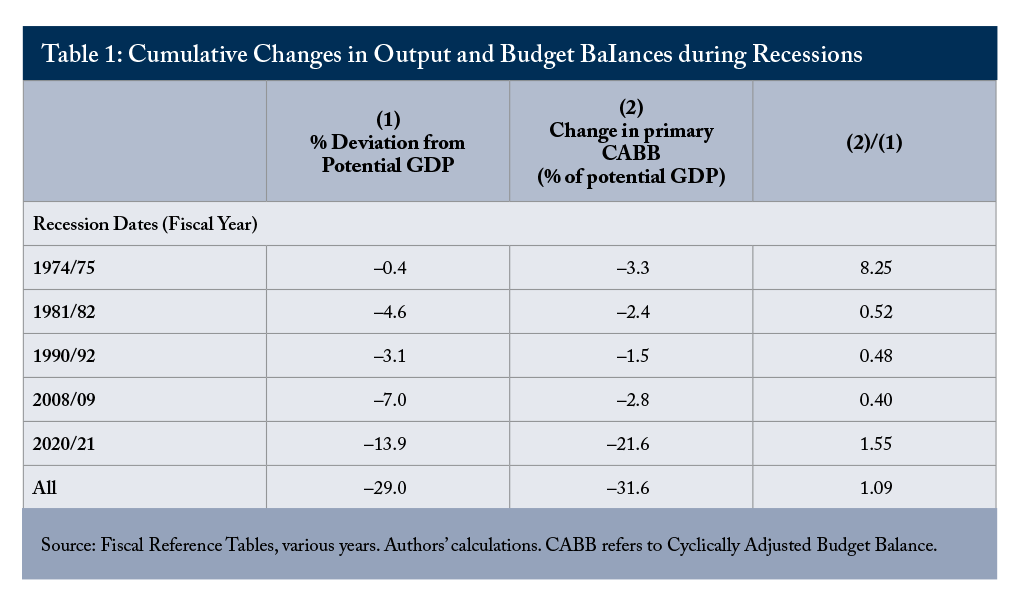
Considering these factors, a more prudent estimate of the budget balance in 2027/28 is a deficit of at least $17 billion, compared with the $4.5 billion surplus forecast in the Fall Economic Statement (Table 1). The deficit could be much larger given the pressure on spending from additional unfunded policy commitments, such as pharmacare, long-term care, additional assistance to Ukraine, and additional funding for disaster relief and disease outbreaks. Further, almost 60 percent of the improvement in the budget balance relative to GDP over the forecast horizon arises from unchanged nominal operating costs from 2022/23 to 2027/28, but there is no discussion of how this is to be achieved.
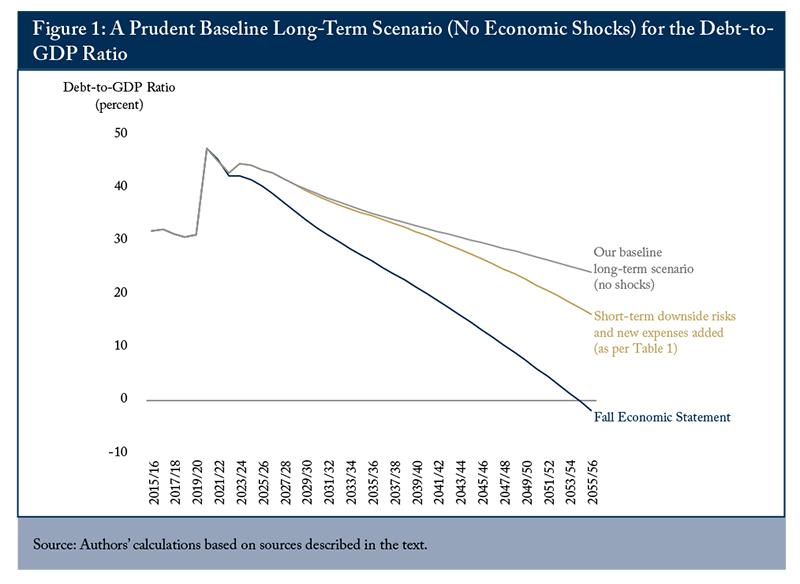
The Fall Economic Statement’s long-run fiscal projection shows debt on a strong downward trajectory over the 28-year projection period, with the federal government achieving positive net worth by fiscal year 2055/56. The projection is based on slightly optimistic assumptions about economic growth
Slightly modifying these assumptions, we develop an alternative, more prudent, baseline long-term scenario. First, we apply the medium-term prudent forecast assumptions described in Table 1, resulting in a revised budget deficit in fiscal year 2027/28 of $16.9 billion, which causes the 2055/56 debt-to-GDP ratio to rise from –1.8 percent to 16.3 percent. Then, we make two additional small adjustments: we assume that overall program spending grows in line with GDP from 2028/29 to 2055/56 – which is certainly a more prudent approach
A significant limitation of this analysis, however, is that the economy is assumed to grow smoothly at potential over the projection period. Economic shocks are certain to interrupt growth, which will put upward pressure on debt. We think a different approach to assessing debt sustainability is required.
First, the analysis should build in the effects of typical economic shocks on the primary balance. Second, the analysis should be able to test whether a reference value of spending, expressed relative to GDP, is consistent with debt sustainability.
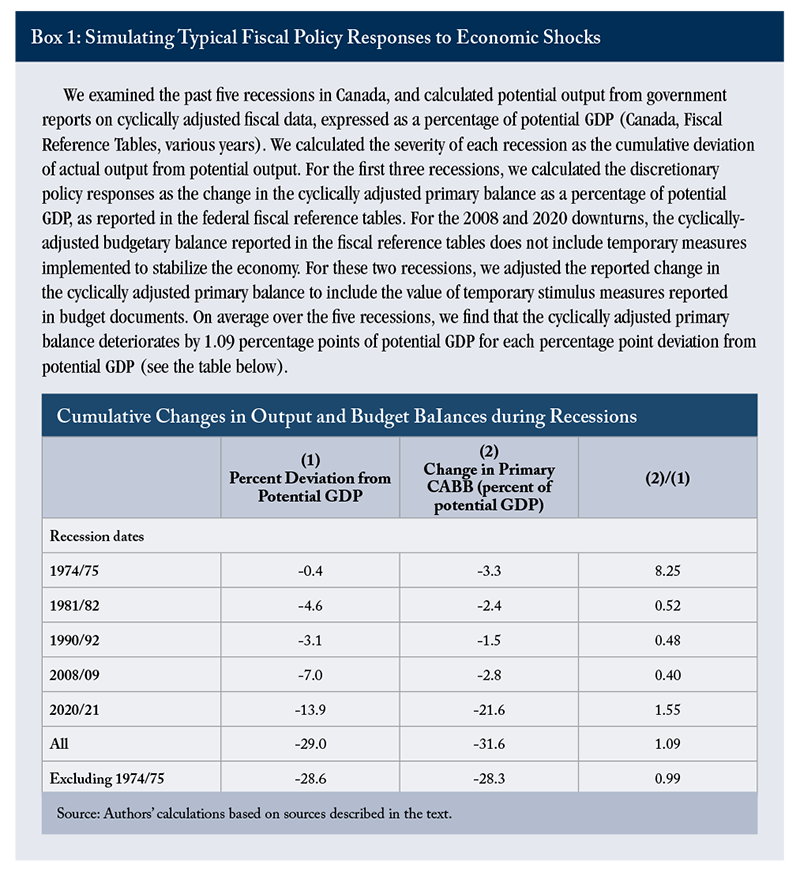
The C.D. Howe Institute Business Cycle Council’s chronology of recessions identifies five recessions in the past 60 years (C.D. Howe Institute 2021). These recessions differed substantially in severity and in the strength of the policy response. We measured the severity of recessions as the cumulative percentage deviation from potential output, and the policy response as the change in the cyclically adjusted primary balance as a percentage of potential GDP, supplemented where necessary by information on policy measures reported in budgets. With this approach, we attempted to measure the discretionary policy response to recessions, excluding the effect of automatic stabilizers. Over a full cycle, automatic stabilizers should have only a minor effect on the level of debt. Debt will rise, however, with temporary fiscal stimulus measures intended to support the economy during a downturn.
We used the probability of recessions and their magnitudes, based on their discrete distribution over the past 60 years, to simulate random business cycles over the period fiscal years 2028/29 to 2055/56
We assessed debt sustainability by calculating the probability that the debt-to-GDP ratio will remain at, or fall below, its value in fiscal year 2027/28 over the long-term projection period. The minimum requirement for sustainability is that the median probabilistic scenario shows a stable debt ratio, which corresponds to a 50 percent probability that the debt ratio will not exceed its initial value over the projection period. Following the International Monetary Fund (IMF 2022b), however, we recommend making adjustments to the fiscal plan if the probability of achieving a stable debt ratio is less than 80 percent
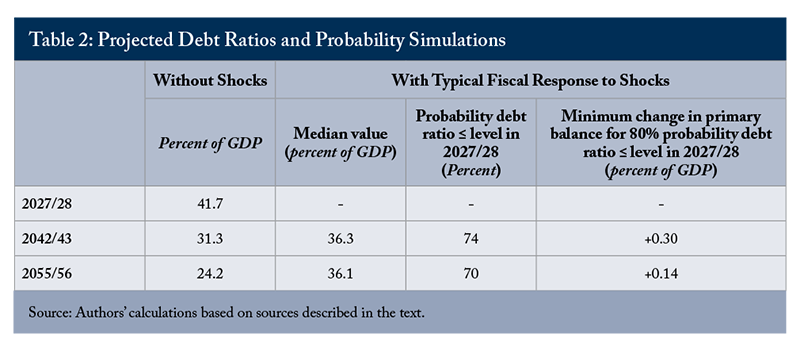
In 2042/43 – fifteen years after the end of the medium-term forecast – the debt ratio is 31.3 percent without allowing for economic shocks (as per Figure 1 above), but the median ratio becomes 36.3 percent in the presence of shocks (Table 2). The probability that the debt ratio in 2042/43 will be lower than or equal to its value in 2027/28 is 74 percent. Extending the projection horizon to 2055/56, the debt ratio is 24.2 percent without allowing for economic shocks, and the median is 36.1 percent in the presence of shocks. The probability that the debt ratio in 2055/56 will be lower than or equal to its value in 2027/28 drops to 70 percent
Probabilities less than 80 percent of capping the debt ratio at its fiscal year 2027/28 value imply that more aggressive fiscal consolidation is required than shown in the medium-term projection. Increasing the probability to 80 percent in 2042/43 would require raising the primary surplus by 0.3 percent of GDP (Table 2).
In sum, after including probable recessions and their likely policy responses to our debt sustainability analysis, we find a material risk that a declining debt-to-GDP ratio will not be achieved over the long run. The federal government’s unfunded spending commitments compound this risk.
Deficit Financing Raises Fairness Issues
Deficit financing raises intergenerational fairness issues since the people benefiting from the spending do not pay its full cost. Shifting the burden of current expenditures to the future in this way is sometimes justified by appealing to the ability-to-pay principle. With sustained productivity growth, future generations will be richer than the current generation, so it is tempting to conclude that asking them to pay more for the government services they consume is equitable. That position is difficult to sustain if it is recognized that continued productivity growth requires continual investment. Future generations become richer because each generation sacrifices consumption in favour of productivity-enhancing investments
The cost imposed on future generations will be even higher if interest payments on the debt rise faster than government revenues, since this eventually would require higher tax rates or lower government spending. This possibility motivates the adoption of a declining debt-to-GDP ratio as a fiscal anchor, which allows government spending to be maintained at a constant share of GDP without putting upward pressure on tax rates.
However, even if an increase in tax rates can be avoided, the counterfactual to be considered is the reduction in tax rates that would be possible if debt and debt-servicing charges were lower. From this point of view, future generations will be paying for services they do not receive even if tax rates are held constant.
Further, the true burden on future generations exceeds the extra interest payments made. Higher absolute levels of debt hurt economic performance, which will reduce the real income of future generations. The economic damage will come from some combination of upward pressure on interest rates and a reduction in incomes induced by borrowing abroad to finance the deficit. Higher interest rates result in less investment, lower productivity and lower wages. Borrowing abroad causes a current account deficit. Restoring balance requires an increase in net exports, which can be achieved only through a decline in real wages.
Stabilization policy does not benefit future generations, but it has to be debt financed to be effective
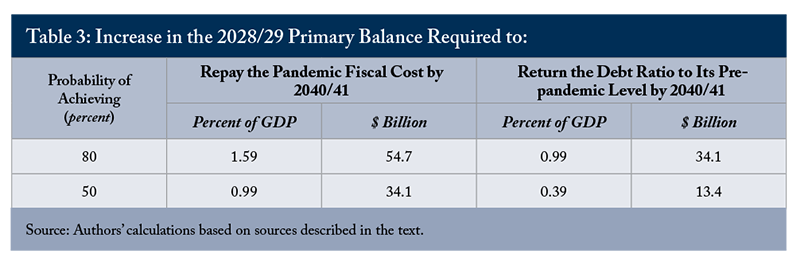
We calculated the increase in the projected fiscal year 2028/29 primary balance – arising from some combination of higher revenues and lower program expenses – that would be required to repay an estimated $507 billion in debt incurred to stabilize the economy during the pandemic by 2040/41 – that is, 20 years after the end of the pandemic-induced recession. Achieving this goal at an 80 percent level of probability would require increasing the primary surplus by 1.6 percent of GDP, which could be achieved by raising the goods and services tax (GST) by 4 percentage points. With this change, the debt-to-GDP ratio would fall to 22.9 percent.
Returning the debt ratio to its pre-pandemic level of 30.7 percent is clearly a substantially less demanding target. The pre-pandemic debt ratio could be achieved with 80 percent probability by increasing the primary surplus by 1 percent of GDP by 2027/28, which is equivalent to about 2.5 GST percentage points (Table 3). With this debt-ratio target, only $90 billion of the $507 billion in pandemic-induced increase in debt would be retired.
Since intergenerational fairness requires that the pandemic-induced debt be retired 18 to 25 years after the end of the recession, the fiscal plan does not have a credible claim to being fair to future generations. Nor is it prudent: there is a material risk that that a declining debt ratio will not be achieved over the long-term projection period. It is our view that a prudent and fair fiscal strategy can only be achieved if the government surrenders some of its fiscal policy flexibility. In the next section, we review different approaches to constraining fiscal policy flexibility adopted in other countries, which informs our proposal.
An Overview of International Experience with Fiscal Rules
Governments’ bias toward deficit financing – incurring deficits in both good times and bad – is a worldwide phenomenon
- Governments perceive an electoral advantage in providing extra services at low or zero near-term cost.
- Governments believe that expansionary fiscal policy is required to support economic growth, even in good times. “For some policymakers the present always falls short of ambitions and warrants fiscal support” (Larch, Mazubris, and Busse 2021).
- Governments either do not believe that deficit financing shifts the cost of providing government services to the future or that such shifting is justified on ability-to-pay grounds.
Recognizing the existence of a deficit bias, and often after experiencing unsustainable increases in debt, many countries have demonstrated their willingness to surrender some of their fiscal policy flexibility by adopting fiscal rules or by committing to prudent and fair fiscal policies. As of 2021, constraints on fiscal policy flexibility have been adopted by 104 countries, including all member countries of the Organization for Economic Co-operation and Development (OECD) except Canada, South Korea and Türkiye (IMF 2022a). To qualify as a fiscal rule, the constraint on fiscal policy has to be enshrined in legislation or be part of other fiscal arrangements that are binding for at least three years
Fiscal rules generally impose operational constraints on policy, committing the government to a specific course of action in annual budgets. Among OECD countries, 31 have a national balanced budget rule, 17 have an expenditure rule, 11 have a debt rule, and 3 have a revenue rule
Independent fiscal institutions, or what the IMF describes as fiscal councils, can play an important role in the effectiveness of fiscal rules. Unless they are part of the country’s constitution, fiscal rules can be modified or repealed by a government with a legislative majority. If fiscal councils are given a role in assessing fiscal plans and monitoring the implementation of fiscal rules, they can raise the reputational and electoral cost of breaking commitments. Most OECD members (31 of 38), including Canada, have a fiscal council. In 27 of these countries, fiscal councils monitor compliance with fiscal rules.
There is a well-established positive correlation between adoption of fiscal rules and attenuation of deficit bias. However, this correlation arises from the higher propensity of countries with a preference for fiscal prudence to adopt fiscal rules (Heinmann, Moessinger, and Yeter 2018). While the typical fiscal rule in a typical country has no effect on fiscal outcomes, well-designed fiscal rules are associated with better fiscal performance (Caselli and Reynaud 2020.)
Another approach is to set out guiding principles, or standards, for fiscal policy with or without legislated rules for achieving the desired results
Blanchard, Leandro, and Zettelmeyer (2021) advocate the guiding-principles approach for the European Union’s supranational rules on deficits and debt, although they recommend enshrining in legislation both the general principles for fiscal policy and the guidance on how to apply them. In their view, rules that attempt to formalize a trade-off between the benefits of stabilization and the costs of rising debt are doomed to fail.
Simple rules have been abandoned in crises due to their rigidity, while more complex rules that permit flexible responses to shocks have not provided a useful framework for fiscal policy. Qualitative prescriptions that leave room for judgment based on the specific situation have a much higher probability of success.
A New Fiscal Policy Framework for the Federal Government
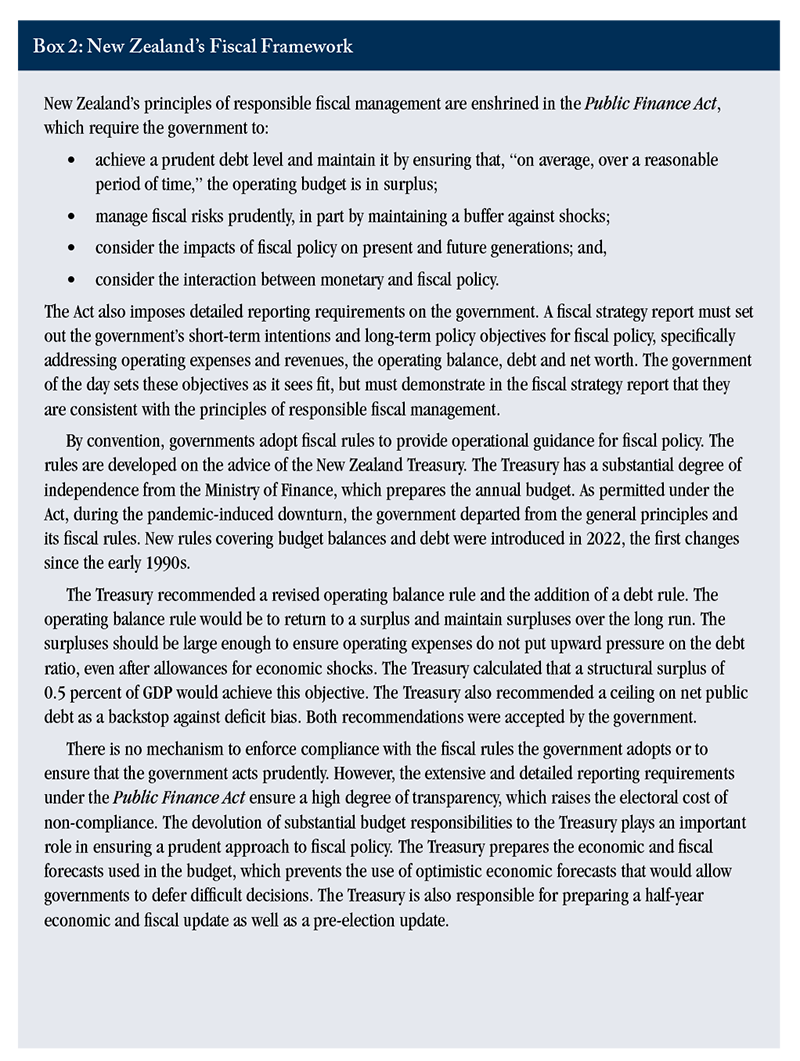
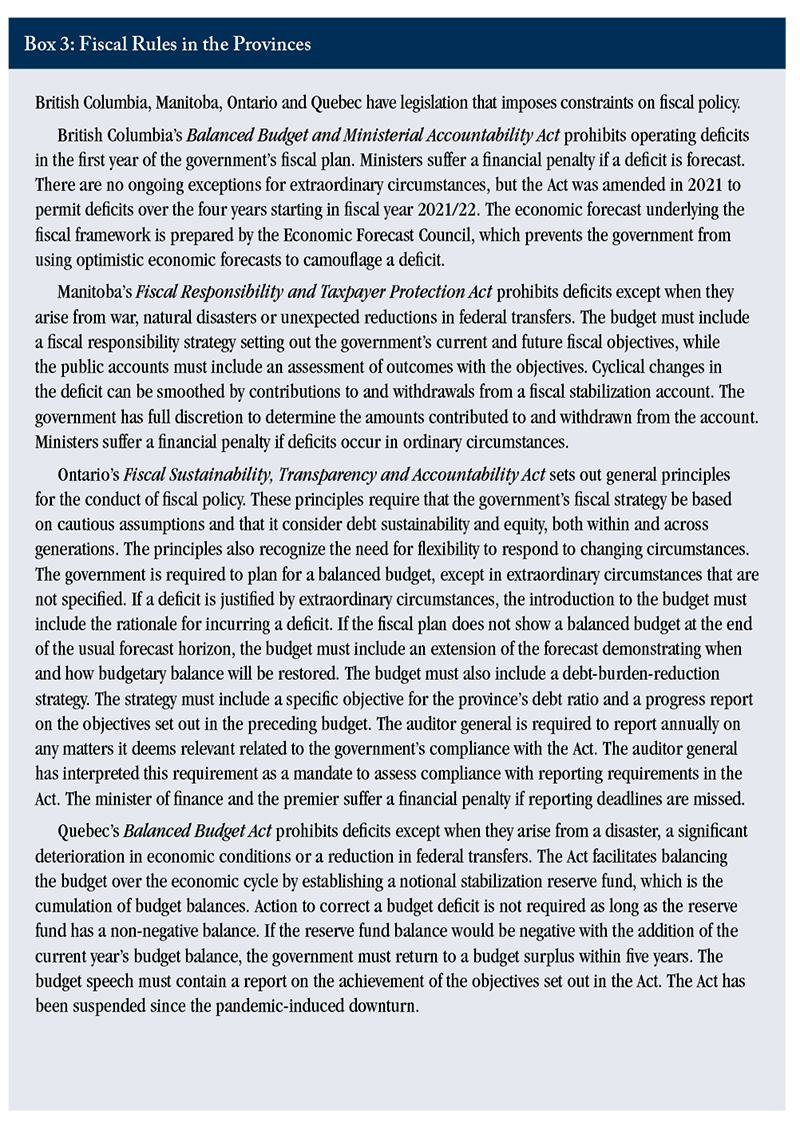
The IMF is optimistic that fiscal rules can be effective in eliminating deficit bias, but we find the arguments advanced by Blanchard, Leandro, and Zettelmeyer (2021) more convincing in light of the evidence. We recommend that the federal government follow New Zealand’s example by setting out in legislation the general principles for the conduct of fiscal policy, reporting requirements and the assignment of responsibilities listed below. Within Canada, four provinces – British Columbia, Manitoba, Ontario and Quebec – have legislation that imposes constraints on fiscal policy (Box 3). The Ontario legislation is similar in spirit and substance to our proposal for the federal government, although it is more prescriptive.
The listed principles address the sustainability of fiscal policy, its role in stabilizing the economy and its impact on intergenerational fairness. The principles are general enough to be relevant in all circumstances; “escape clauses” would be unnecessary and the legislation would not have to be changed as a result of a severe economic downturn. The federal government would develop a fiscal framework consistent with these principles, and develop non-legislated operational rules or fiscal anchors to guide annual policy and monitor progress. Only one constraint would be mandatory: the government would be required to set a rolling multiyear ceiling on non-cyclical spending. Such a rule would prevent governments from spending revenue windfalls, which would make it easier to manage debt prudently. The non-legislated operational rules could be revised as circumstances change.
Compliance would be encouraged by requiring the government to demonstrate that its fiscal framework is consistent with the principles and by mandating the Parliamentary Budget Officer (PBO) to provide an opinion on the government’s assessment of consistency. The PBO now prepares a fiscal sustainability report for the federal and provincial governments based on its own economic and fiscal forecasts. In its analysis, the PBO makes a baseline debt projection based on assumptions about economic growth, interest rates, and government revenues and spending. This baseline projection is subjected to a variety of stress tests conducted by changing assumptions about the debt drivers one at a time. The analysis assumes stable values for the debt drivers and does not capture any interactions between debt and interest rates. Under our proposals, the PBO would adopt an enhanced version of the probabilistic approach to analysing debt sustainability used in this E-Brief
We are concerned that intergenerational fairness and investment in public infrastructure do not get enough weight in the government’s fiscal framework. Consequently, we recommend that periodic reports on these issues be published by the PBO. Finally, we judge that up-to-date knowledge of the state of government finances prior to an election can attenuate deficit bias, so we recommend that the government be required to publish a pre-election economic and fiscal update.
The following provisions would be enshrined in legislation.
Fiscal principles
1. Debt must be managed prudently, bearing in mind the issues of sustainability, economic stabilization and the impact of debt on present and future generations.
2. Gaps between prudent and actual or projected debt levels must be eliminated over a reasonable period of time, bearing in mind the state of the economy and the stance of monetary policy.
Reporting requirements
1. The government must table a budget and a mid-year economic and fiscal update before Parliament annually. Current reporting conventions must be enhanced by adding to the budget documents:
a a clear statement of the government’s short-term intentions and longer-run objectives for spending, taxation, the budget balance, debt, and net worth;
b operational rules or anchors to guide policy and to monitor progress toward the fiscal objectives; these rules must include a rolling multiyear ceiling on non-cyclical spending; and
c a demonstration that the forecasts and the debt projection are consistent with the fiscal principles; in particular, it must be demonstrated that the risks to the forecasts and projection have been prudently assessed.
2. The government must prepare, at least every three years, a report analysing the intergenerational impacts of fiscal policy and advising on changes to the fiscal framework that will promote intergenerational fairness. The advice will take into consideration the relevant economic, social, and demographic factors that affect the intergenerational distribution of fiscal burdens.
3. The government must prepare, at least every three years, a report analysing the state of all significant government assets and liabilities. The report must also provide a projection of investment requirements over the longer term.
4. The government must prepare a pre-election economic and fiscal update. The update must be made public no more than 60 days prior to and no more than 7 days after the start of the election period.
Delegation of responsibilities
1. The Parliamentary Budget Office (PBO) will assess and offer an opinion on the consistency of the fiscal framework with the fiscal principles. The assessment will make use of a probabilistic approach to debt sustainability.
2. The PBO will prepare the reports on intergenerational fairness and investment.
Amending the fiscal principles legislation
1. The legislation setting out the fiscal principles can be amended or eliminated only after public hearings conducted by a parliamentary committee.
Concluding Remarks
The Fall Economic Statement shows deficits declining over the forecast horizon and the debt-to-GDP ratio on a steep downward trend over the long-term projection period, prompting Minister Freeland to describe the fiscal plan as prudent, sustainable, and fair to future generations. We disagree. The fiscal plan is not prudent: it overstates the amount of fiscal consolidation that is likely to occur by the end of the forecast period, and the long-term trend decline in the debt ratio is overstated due to optimistic assumptions. In addition, including probable recessions and likely policy responses in the debt sustainability analysis shows that there is a material risk that a declining debt ratio will not be achieved over the long-term projection period. Since intergenerational fairness requires that the pandemic-induced debt be retired 18 to 25 years after the end of the recession, the fiscal plan does not have a credible claim to being fair to future generations.
Canada is not alone in incurring deficits in good times and in bad. Recognizing this deficit bias, many governments have surrendered some of their fiscal policy flexibility by adopting fiscal rules or fiscal anchors. An international review of fiscal rules has led us to propose a new fiscal policy framework for Canada, in part based on our assessment of New Zealand’s fiscal responsibility provisions (New Zealand Treasury 2015).
Success will largely depend on buy-in from the public and political parties on the need for sustainable and fair fiscal policies. Setting out the general guiding principles for fiscal policy, allowing governments a high degree of discretion in applying these principles, and requiring an independent assessment of compliance with the principles are the key ingredients to set in motion a self-reinforcing circle of fiscally sustainable policies.
The authors thank Daniel Schwanen, Rosalie Wyonch, William Robson, and anonymous reviewers for helpful comments on an earlier draft. The authors retain responsibility for any errors and the views expressed.
References
Bank of Canada. 2022. “Monetary Policy Report.” Ottawa. April.
Beetsma, Roel, MWJ, and Xavier Debrun. 2016. Fiscal Councils: Rationale and Effectiveness. International Monetary Fund.
Blanchard, Olivier, Alvaro Leandro, and Jeromin Zettelmeyer. 2021. “Redesigning EU Fiscal Rules: From Rules to Standards.” Economic Policy 36 (106): 195–236.
Caselli, Francesca, and Julien Reynaud. 2020. “Do Fiscal Rules Cause Better Fiscal Balances? A New Instrumental Variable Strategy.” European Journal of Political Economy 63: 101873.
Dahlby, Bev and Ergete Ferede. 2023. “Stress Testing the Federal Fiscal Anchor.” Fraser Institute. March.
Debrun, Xavier, Jonathan D. Ostry, Tim Willems, and Charles Wyplosz. 2019. “Debt Sustainability.” Sovereign Debt: A Guide for Economists and Practitioners 151.
Eyraud, Luc, Mr Xavier Debrun, Andrew Hodge, Victor Duarte Lledo, and Ms Catherine A. Pattillo. 2018. Second-Generation Fiscal Rules: Balancing Simplicity, Flexibility, and Enforceability. International Monetary Fund.
Heinmann, Freidrich, Marc-Daniel Moessinger, and Mustafa Yeter. 2018. “Heinemann: Do Fiscal Rules Constrain Fiscal Policy? A Meta-Regression Analysis.” European Journal of Political Economy 51: 69–92.
International Monetary Fund. 2021. “Review of the Debt Sustainability Framework for Market Access Countries.” 2021–003. Policy Paper. International Monetary Fund. https://www.imf.org/en/Publications/Policy-Papers/Issues/2021/02/03/Rev….
———. 2022a. “Fiscal Rules Dataset, 1985-2021 - International Monetary Fund.” https://www.imf.org/external/datamapper/fiscalrules/IMF%20Fiscal%20Rule….
———. 2022b. “Staff Guidance Note on the Sovereign Risk and Debt Sustainability Framework for Market Access Countries.” 2022–039. IMF Policy Papers. International Monetary Fund. https://www.imf.org/en/Publications/Policy-Papers/Issues/2022/08/08/Sta….
Larch, Martin, Janis Mazubris, and Mathias Busse. 2021. “Optimism Is Bad for Fiscal Outcomes.” 234. SUERF Policy Briefs. SUERF, The European Money and Finance Forum.
Lester, John. 2021. “Who Will Pay for the Economic Lockdown?” 594. Commentary. C.D. Howe Institute. https://www.cdhowe.org/public-policy-research/who-will-pay-economic-loc….
New Zealand Treasury. 2015. “An Introduction to New Zealand’s Fiscal Policy Framework.” Wellington: Government of New Zealand. https://www.treasury.govt.nz/sites/default/files/2015-03/nzfpf-A5.pdf.
Tombe, Trevor, and Yu (Sonja) Chen. 2023. “Reversal of Fortunes: Rising Interest Rates and Losses at the Bank of Canada.” E-Brief 337. Toronto: C.D. Howe Institute. January.
This E-Brief is a publication of the C.D. Howe Institute.
John Lester is an Executive Fellow at the School of Public Policy at the University of Calgary.
Alex Laurin is Director of Research at the C.D. Howe Institute.
This E-Brief is available at www.cdhowe.org.
Permission is granted to reprint this text if the content is not altered and proper attribution is provided.
The views expressed here are those of author. The C.D. Howe Institute does not take corporate positions on policy matters.
Online Appendix:
Additional Information on Debt-to-GDP Scenario Projections
A. Long-Term Fiscal Scenario – Baseline Assumptions
Our long-term fiscal modelling starts in fiscal year 2028/29 and ends in fiscal year 2055/56. This period corresponds to Finance Canada’s long-term projection scenario presented in the 2022 Fall Economic Statement (“FES”).
Our preferred baseline assumptions are largely based on the FES. Our starting point is the 2027/28 budget balance, primary balance, and debt charges projected in the FES downside scenario, adjusted for additional expenses discussed in the main text, i.e., unidentified savings from the strategic policy review and Canada Health Transfer increases.
The primary balance is total revenues less overall program spending, which includes net actuarial losses.
Revenues grow linearly with projected nominal Gross Domestic Product (GDP). In the FES projections, overall program spending growth does not keep pace with GDP growth, leading to a rising primary surplus over the forecast horizon. This modelling approach is based on a detailed examination of program parameters. Nevertheless, we assume that governments maintain the real value of permanent programs over time and implement new programs to replace temporary ones, so that overall program spending rises at the same pace as GDP. This approach allows us to assess the sustainability of a given level of program spending.
Projected GDP is a function of labour productivity growth and labour supply growth, as in Laurin and Drummond (2021). The GDP projection model used in Laurin and Drummond (2021) is calibrated to the FES assumptions leading to average annual nominal growth of 3.6% over the projection period (as in the FES).
We project debt charges going forward based on the assumption that effective interest rates gradually increase from 2.88 percent in 2027/28 (our estimate of the FES downside scenario rate) to 3.88 percent by 2055/56 – causing the average effective interest rate over the period to equal average projected GDP growth (3.6%). Projected effective interest rates are applied to prior-year interest-bearing debt to yield current year debt charges. Interest-bearing debt changes with the projected primary balance.
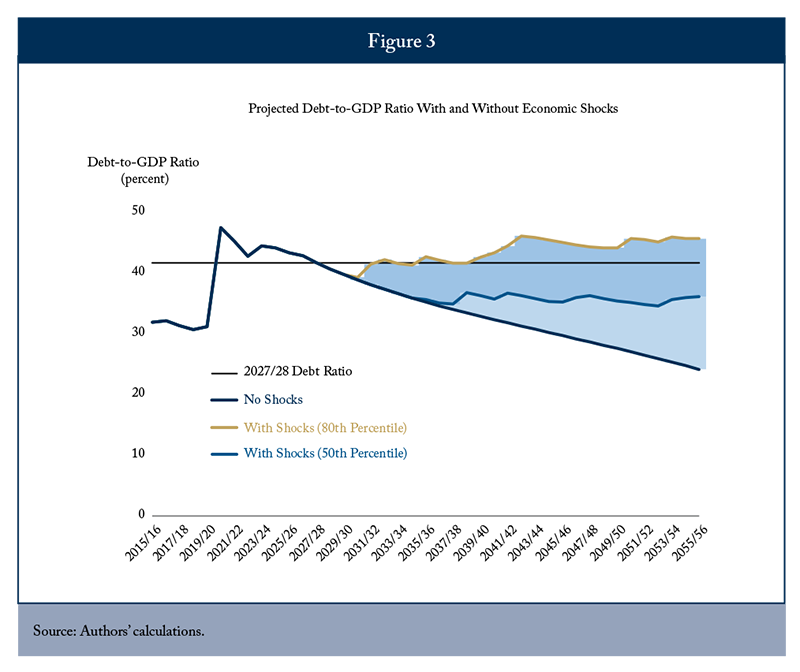
The projected debt-to-GDP ratio in our baseline (no economic shocks) scenario is presented in Figure 3 below.
B. Adding the Impact of Economic Shocks
Economic shocks affect the primary balance through cyclical changes to revenues and expenses (automatic stabilizers). In addition, downturns typically lead to additional discretionary policy responses intended to support incomes and the economy during a recession. Over a full cycle, cyclical changes should have only a minor effect on the level of debt. On the other hand, debt will rise with temporary fiscal stimulus measures. Therefore, adding potential economic shocks to our baseline (no shocks) long-run fiscal scenario will lead to a higher debt ratio.

We examined the past five recessions in Canada, and calculated potential output from government reports on cyclically adjusted fiscal data, expressed as a percentage of potential GDP (Fiscal Reference Tables, various years). We calculated the severity of each recession as the cumulative deviation of actual output from potential output.
For the first three recessions, we calculated the size of the discretionary policy responses as the change in the cyclically adjusted primary balance as a percentage of potential GDP, as reported in the federal fiscal reference tables. For the 2008 and 2020 downturns, the cyclically adjusted budgetary balances reported in the fiscal reference tables do not include temporary measures implemented to stabilize the economy. For these two recessions, we adjusted the reported change in the cyclically adjusted primary balance to include the value of temporary stimulus measures reported in budget documents. On average over the five recessions, we find that the cyclically adjusted primary balance deteriorates by 1.09 percentage points of potential GDP for each percentage point deviation of actual output from potential GDP (see Table 1).
Since the frequency and magnitude of future business cycles are unknown, we randomly simulate 1,000 future scenarios for the next 60 years based on the historical discrete distribution of recessions and their severity over 1961 to 2020, as measured in Table 1. In doing so, we ensured that the length of time in between recessions is randomly determined but we imposed a minimum of 2 years between recessions. We also rejected a few extreme scenarios in which the number of very severe recessions (corresponding to year 2020/21 in our sample) exceeded 2 per 60 years, and scenarios in which there was only one downturn over the 60 years.
The average number of recessions (or business cycles) per simulated scenario matches almost exactly our historical sample (5 recessions), as well as their average severity (5.8%). (See Figure 1 for frequency distributions.) The panel on the left shows the count of simulated scenarios by the number of recessions per scenario. The panel on the right shows the count of simulated scenarios by the average severity of recessions per scenario.
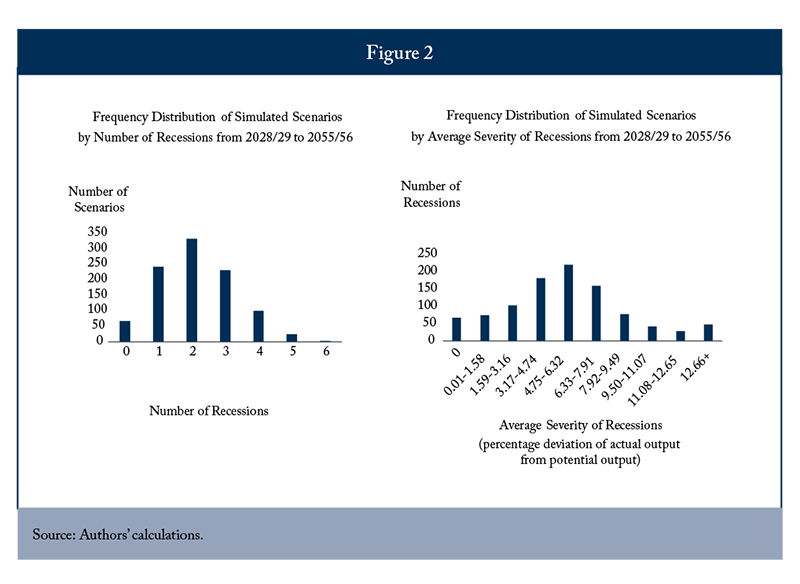
Our fiscal projections span 28 years, i.e., from 2028/29 to 2055/56, so we only use the first 28 years of each simulated scenario. Figure 2 shows the frequency distribution of recessions over the 28-year period used for our fiscal simulations.
Randomly simulated discretionary policy responses over the projection period (2028/29 to 2055/56) increase debt above our baseline (no shocks) fiscal scenario through their impact on the primary balance. Figure 3 shows the impact of simulated economic shocks on our baseline (no shocks) long-term fiscal projection at the 50th percentile (the bottom 50 percent of simulated scenarios are located inside the light-blue shaded area) and at the 80th percentile (the next 30 percent of simulated scenarios are located inside the dark-blue shaded area).
The figure illustrates the point that the probability of the debt ratio remaining below its level in 2027/28 throughout the projection period is above 50 percent but below the 80 percent threshold used by the IMF to classify debt sustainability as “highly probable.” Increasing the probability to at least 80 percent throughout the projection period would require raising the primary balance by 0.3 percent of GDP in 2027/28.