The Institute’s unique variables from past work include its:
- Vulnerability Barometer: tracks vulnerabilities across the banking, corporate, household, and housing sectors – a higher score means increased vulnerability;
- Diffusion Index: conveys in a single number the extent to which the ups and downs of an economy are widespread by industry in any given period – where 50 can be thought of as an economy with the same number of industries expanding and contracting;
- Money Overhang Index: tracks the gap between broad money trend growth (M2++) and trend inflation, and where a higher gap, if driven by shocks to money growth, means inflation will have to play catch up (with the opposite true as well);
- Monetary Policy Tightness/Looseness Indicator: estimates a range of where the overnight rate might have been expected to sit based on different versions of the Taylor rule; and
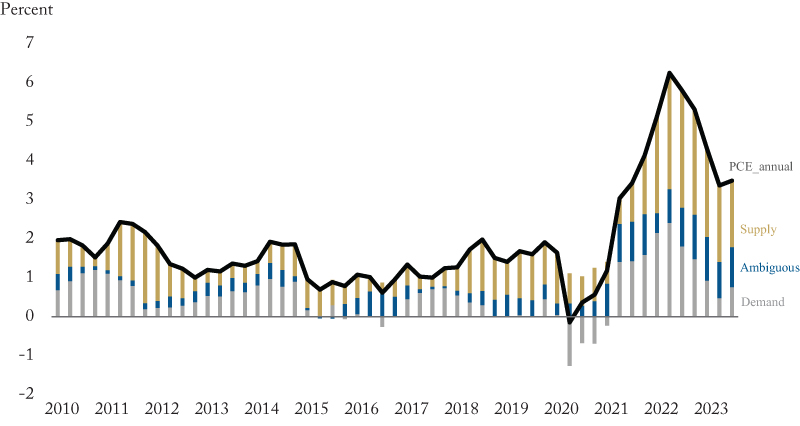
- Supply/Demand Contributions to Inflation: measures product-level price changes and empirically identifies whether they have been mainly supply driven (that is, by energy prices, wages or other input costs) or demand driven (by consumer expenditures, fiscal policy and so on), aggregating them across each category (supply, demand, ambiguous).
Document
All Graphs_Website_Jan2024.xlsx139.99 KB
Figure 1: Vulnerability Barometer – 1990Q1 – 2023Q3
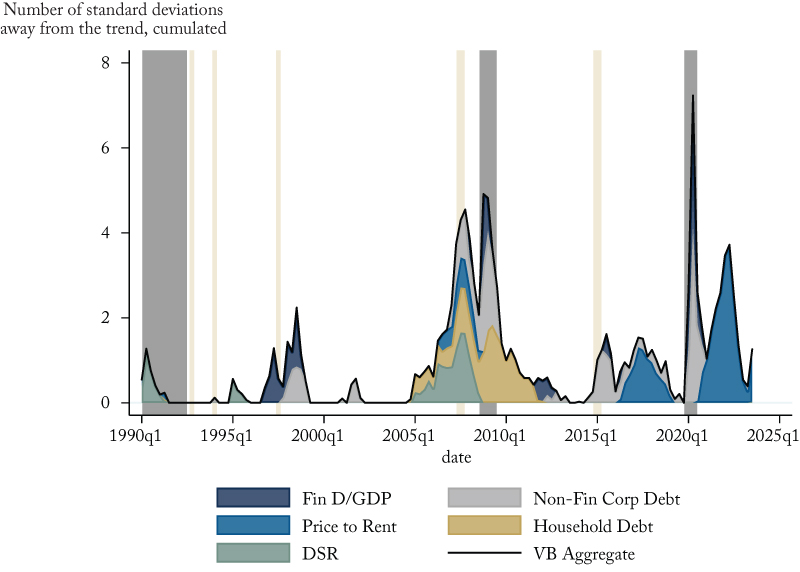
Figure 2: Diffusion Index – Jan 2007 – Oct 2023
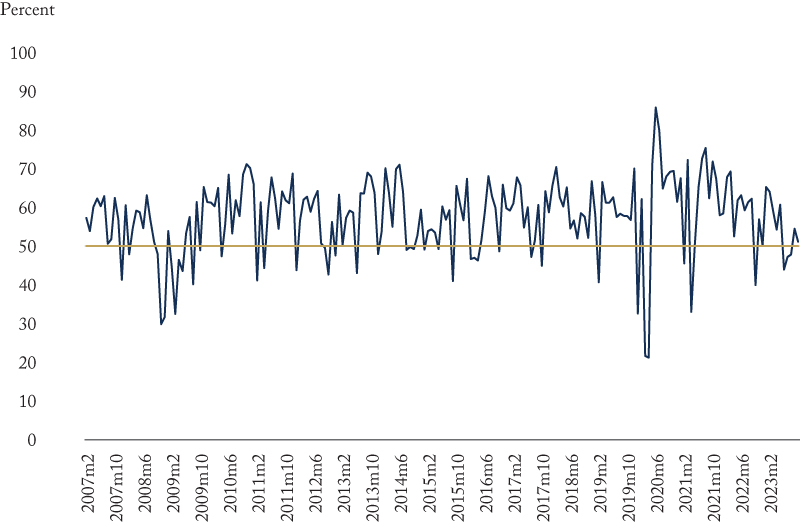
Figure 3: Money Overhang Index – Jan 1996 – Oct 2023
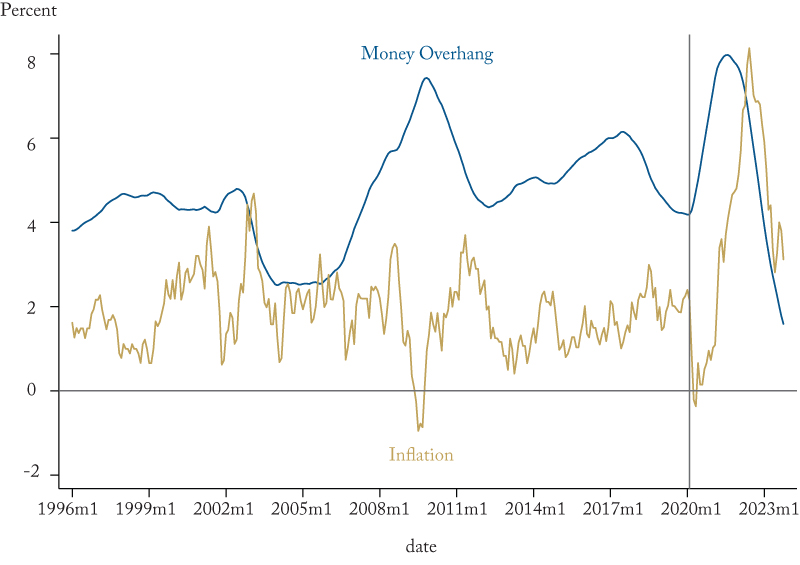
Figure 4a: Taylor Rule Range Indicator – Integrated Output Gap, Jan 1996 – Jun 2023
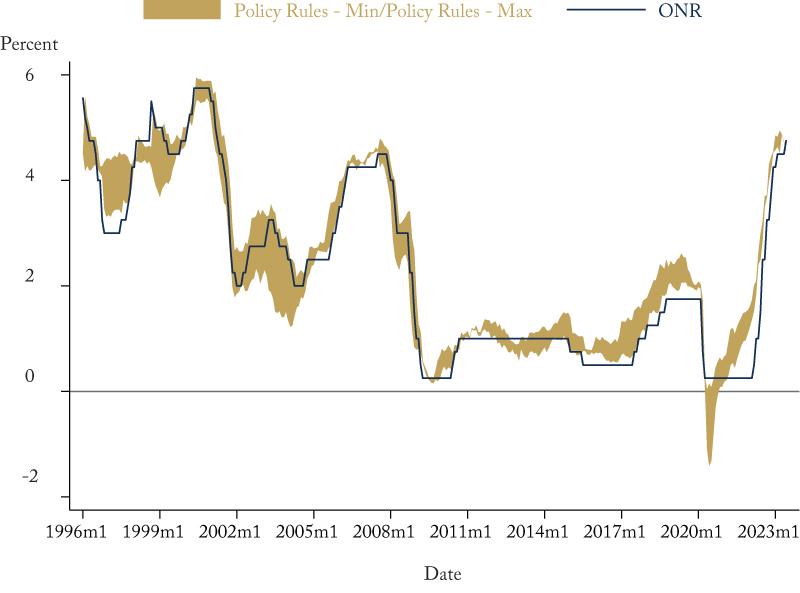
Figure 4b: Taylor Rule Range Indicator – Unemployment Rate, Jan 1996 – Nov 2023
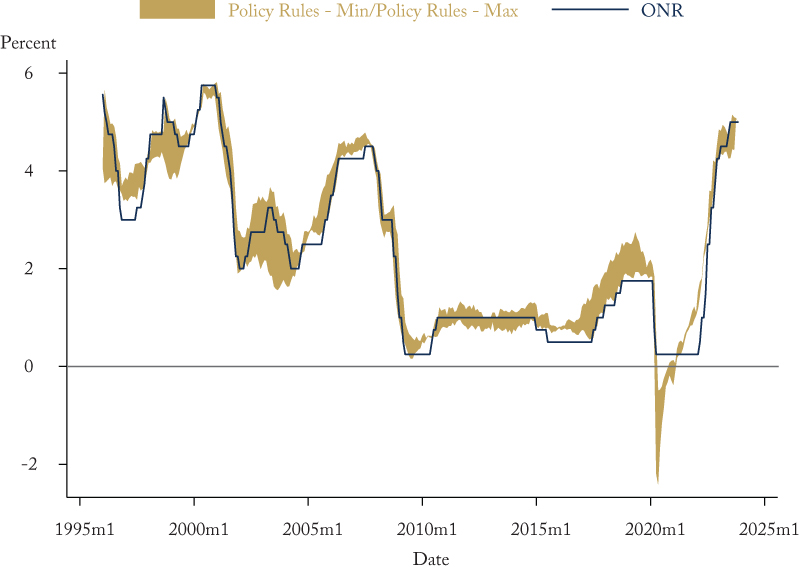
Figure 5: Contribution of Supply and Demand to Annual Price Changes in the Personal Consumption Expenditure Index, Canada, 2010Q1 – 2023Q3