
The Study In Brief
The budgets governments present around the beginning of their fiscal years and the financial statements they publish in their annual reports after their fiscal years have ended are critical tools for legislators and voters to hold them accountable. The transparency of these documents to non-experts has always mattered: they should let readers understand governments’ plans, see how results differed from these plans and assess governments’ future capacity to deliver services. The fiscal stresses of the COVID-19 crisis will make these attributes even more critical in the years ahead. This report assesses the quality of the budgets and annual reports of 31 major Canadian municipalities according to their usefulness for these purposes.
The grades we derive in this year’s version of our annual survey range from A to F. At the bottom of the scale are Regina and Saskatoon, whose financial documents fail to meet a minimal standard of transparency, usefulness and timeliness. At the top is Vancouver, whose documents earn an A+ for their clarity, completeness and promptness. Surrey and Quebec City, each with an A, and Markham, Richmond, Vaughan, and Laval each with an A-, also stand out favourably.
The financial statements Canadian municipalities publish after year-end are typically well organized. They follow public sector accounting standards (PSAS) and present the key figures where users can easily find and identify them. While some of the municipalities we look at released their results late, and we have reservations about below-the-line adjustments that can cloud understanding of the municipality’s fiscal capacity, we generally award high scores for these municipalities’ financial statements.
By contrast, many municipalities’ budgets present readers with challenges. Most do not present PSAS-consistent figures that are easy to find, and many do not present them at all. Most of the 31 present separate operating and capital budgets, with the latter prepared on a cash basis. Even experts will struggle to reconcile such budgets with past results or to use them to predict what the municipality will report at year-end. Many budgets also separate tax- and rate-supported activities, making totals for revenues and expenses even harder to calculate. Worse, municipal councillors often voted on budgets after the fiscal year started and money was already being spent.
These challenges matter. Opaque budgets have real-world consequences, ranging from disengagement by people who do not understand them and lack of awareness of the generally robust financial condition of Canadian cities, to funds collected up front for capital projects that may not occur for years and neglect of infrastructure maintenance.
Our core recommendation is that municipal governments should present budgets using the same accounting standards and format that they use in their year-end financial statements. One key implication would be that municipal budgets would use accrual accounting with respect to capital, recording revenues and expenses as assets deliver their services. Provincial governments that impede the preparation of PSAS-consistent municipal budgets – for example, by mandating separate operating and capital budgets – should stop doing so.
A second implication of using PSAS-consistent accounting in all documents is that municipal budgets, like municipal financial statements, would show city-wide consolidated gross revenue and spending figures that represent the city’s full claim on its citizens’ resources and the full scope of its activities. Along with more transparently presented numbers and more timely information, these changes would raise the fiscal accountability of Canada’s municipalities to a level more commensurate with their importance in Canadians’ lives.
Note to Readers: This is a revised version of the Commentary first published in February 2022. It features revised scores for Laval.
We thank Alexandre Laurin, Philippe Chenard, members of the C.D. Howe Institute’s Fiscal and Tax Competitiveness Council and other reviewers for comments on earlier drafts, and Nicholas Dahir for help with data. This report is part of a decade-long C.D. Howe Institute project on municipal fiscal accountability (Dachis and Robson 2011). Among the many colleagues and reviewers who have provided advice on the project, we highlight the comments of municipal officials, which have improved our grading system and our discussion of it, and deepened our understanding of the legal and institutional context of municipal budgeting. We are responsible for the conclusions and any errors.
Introduction
Canada’s cities provide vital services such as policing and firefighting, roads and transit, water and sewers, parks and recreation. To do so, they raise and spend large amounts of money, and the taxes and charges they levy affect where Canadian households and businesses live and invest. The fiscal stresses of COVID-19 on all governments will make their financial performance and capacity to deliver services in the future a more pressing question in the years ahead.
For these reasons, Canadians need their governments to present financial information that meets high standards of transparency, usefulness and timeliness. However, as this report card on the budgets and annual reports of 31 major Canadian municipalities reveals, many cities fail to meet these standards.
The problems are not so much with the year-end financial statements in their annual reports, although this survey highlights some concerns, notably with timeliness. The more pervasive issues are with the budgets municipalities present around the beginning of the fiscal year. In most cities, simple questions such as how much the government plans to spend, how its plans compare with its current activities and what its plans imply for its capacity to deliver future services are impossible for non-experts to answer.
Moreover, many municipal budgets understate the size of city operations, omit key activities and exaggerate the costs of capital projects. Many municipalities vote on their budgets after the fiscal year has started and publish financial information so late that decisions about the budget for the year following the reporting year are already made.
Municipal budgeting and accounting are not arcane matters – they have real-world consequences. For example, the big price tags in cash-based capital budgets likely bias councillors against investing in some long-life infrastructure and induce them to raise too much money up front to finance the projects they do undertake. Focusing on cash transactions also encourages neglect of obligations that will come due in the future, including repair and replacement of infrastructure.
Finally, inconsistent budgeting can cause disengagement or undue pessimism among citizens. Civic engagement suffers if people do not understand what their governments are saying, or think that what their governments are saying has no relationship to what will actually happen. Discussions about potential changes in taxes, services or government transfers would be more fruitful if people knew that Canada’s cities have accumulated substantial surpluses and are in better financial shape than many budget debates suggest.
How can Canadian municipalities improve accountability for the money they raise and spend? A key recommendation is that they should present their annual budgets on the same accounting basis as their year-end financial statements. Provincial governments that impede accrual-based budgets at the municipal level – for example, by requiring separate operating and capital budgets – should stop doing so. Municipalities that face those impediments can and should publish supplementary information on their own.
In addition, budgets and financial statements should show consolidated revenues and expenses. Netting fees from the totals, such as charges for water, sewage and parking – and the cost of these services – hides important activities and means that only experts with lots of time for the task can compare intentions with results.
Better accounting in budgets, clearer presentation of key numbers and timelier publication would help raise the financial management of Canada’s cities to a level more appropriate to their importance in Canadians’ lives.
Measuring Fiscal Accountability
Financial documents are tools to help people make decisions. To be useful, they must be accurate, complete, and present information that lets users readily find and interpret the principal numbers. In the case of government financial documents, an essential minimum is that a reader who is motivated and numerate, but not an expert in accounting, should be able to easily find consolidated revenues and expenses, and the resulting surplus or deficit, and relate those numbers to changes in the government’s net worth and its capacity to deliver future services.
Governments’ financial documents inform the votes that authorize spending, taxing and borrowing, as well as the votes citizens cast in elections. Accountability for public funds is central to representative government. Legislators and citizens need financial information to help them monitor whether public employees are doing what they are supposed to do, and citizens require it to help them monitor whether legislators are doing what they promised to do. Along with measures of performance such as adherence to schedules in public transit, diligence in waste removal and quality of drinking water, financial documents let legislators and citizens monitor what is happening and take corrective action if necessary.
The Fiscal Cycle and Principal Documents
Like most organizations, and like Canada’s senior governments, municipalities produce two key documents in their annual fiscal cycles: budgets and audited financial statements.
Budgets contain fiscal plans for the coming year. They provide the principal opportunity for elected representatives, the public and the media to learn about, and provide input on, municipal priorities. Municipal budgets typically inspire a great deal of debate in councils, with media coverage and attention from the interested public. Ideally – as is the case for most senior governments, but too few municipalities, as we will see – key exhibits in a budget are a projected statement of operations showing consolidated revenues and expenses, along with the resulting annual surplus or deficit, and the impact that surplus or deficit will have on the municipality’s accumulated surplus – its capacity to deliver services.
Year-end audited financial statements show what a municipality actually raised and spent during the budget year, the resulting change in the municipality’s accumulated surplus. Using Public Sector Accounting Standards (PSAS) ensures that cities’ year-end financial statements provide largely comparable measures of revenue, expenses and financial position, with councillors, citizens and the media getting additional comfort from certification by external auditors.
The starting point for most users of a government budget or financial report are the headline figures for revenues and expenses along with the surplus or deficit. A citizen/taxpayer, councillor or journalist will typically start by asking how much the government plans to raise and spend in the coming year or actually raised and spent in the year just past. Those numbers are the basis for further questions, such as how future plans compare to past performance and how well results corresponded to past plans – and, if discrepancies are large or poorly explained, how to reduce them in the future.
To get users who are numerate and motivated, but not necessarily expert, started on these questions, budgets and financial statements must have certain features. The key numbers must appear early, prominently identified with clear language. The numbers should be consistent with PSAS: they should present the full picture of the municipality’s activities, including all services, regardless of how they are funded. In PSAS terms, revenues and expenses should be consolidated. The numbers in one document should match their counterparts in others, allowing for comparisons of intentions to results – both final results for past years and estimated results for the latest year – and comparisons of results to intentions.
The financial documents of well-run Canadian businesses and charities, and those of most Canadian senior governments (Robson and Wu 2021a), satisfy these conditions. In the case of senior governments, consolidated revenues and expenses, and surpluses or deficits, appear clearly in their budgets and financial statements, usually on one page. Regulators typically require listed companies to file their financial results no more than four months after the end of their fiscal years (see, for example, OSC 2021).
While the municipal financial statements in this survey typically score well on these criteria, most of their budgets do not. Notably, they use accounting that is not consistent with PSAS. Readers of those cities’ financial documents cannot easily find the information that will help them understand the city’s projections relative to past experience at the start of the year, nor how actual results compare to projections after year-end, nor the relationship between the budget’s bottom line and the change in the city’s accumulated surplus.
The Challenge of Non-PSAS-Consistent Municipal Budgets
Many readers of this Commentary will be surprised to learn that most Canadian cities do not present budgets that match their financial statements. They will no doubt be further surprised to learn that our repeated recommendation that cities should present PSAS-consistent budgets is controversial.
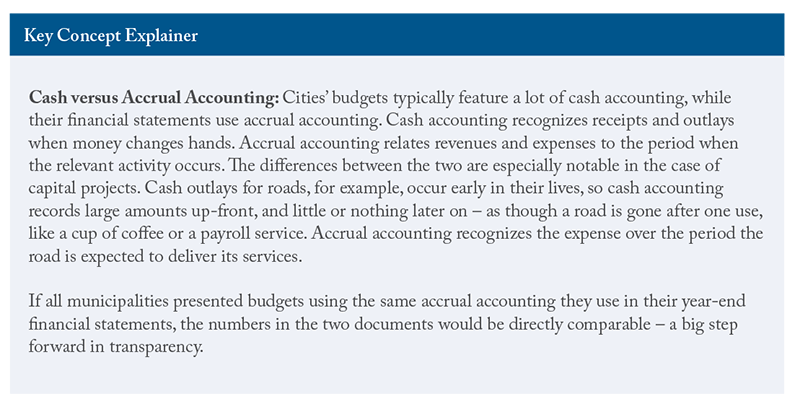
Most municipal budgets depart from PSAS in two major ways, each with its own history and rationale. A fundamental departure is with respect to accrual accounting. Accrual shows revenues and expenses during the period when the relevant activity occurred, rather than when any cash involved changed hands. Accrual accounting records the expenses associated with long-lived items such as buildings, roads and sewers as they deliver their services – ideally, writing them down over the years in which they remain useful and before they need replacing. This approach means that the difference between consolidated revenue and expense, the surplus or deficit, represents the change in the government’s net worth – its capacity to deliver services – over the course of the year.
PSAS mandate accrual accounting. But while municipalities use accrual accounting in their budgets in some areas, such as receivables and payables, they typically do not use it for capital projects. Instead, they apply cash accounting to capital outlays as they occur – a big cost upfront and nothing thereafter.
Because cash outlays for capital are so different from cash outlays for operating costs, Canada’s municipalities typically present separate operating and capital budgets, rather than showing consolidated revenues and expenses on the same PSAS-consistent basis used in their financial statements. This difference makes the budgets of most municipalities impossible for non-experts to reconcile with their financial statements.
With accrual accounting, cash collected in taxes, or received from senior governments in transfers, to finance capital items need not be recorded as revenue until the item in question is delivering its services. Until it is recorded in revenue, the cash on the asset side of the municipality’s statement of financial position has a counterpart liability, “deferred revenue,” which signifies the municipality’s obligation to build the item. The money is not the city’s to do with as it pleases.
In most municipal budgets, the focus on cash and the separation of operating from capital budgets means funds received during the year but not required for capital outlays during that year flow into “reserves,” and funds received in prior years that are required for capital outlays during the year flow out of “reserves.” Adding and subtracting flows of funds into and out of reserves to operating spending and revenue means that operating budgets are mixing items that do not affect the annual surplus or deficit, and the city’s net worth, with items that do. The focus on cash and separate operating and capital budgets also means that budgets in many municipalities do not include the writing down of the value of capital assets as they deliver their services – a category of expense that is large for municipalities, which are capital-intensive operations.
A second deviation from PSAS in many municipal budgets relates to the comprehensiveness of the figures reported for revenue, expense and the surplus or deficit. PSAS mandate that financial statements present consolidated numbers, capturing the full range of activities under the control of the reporting entity. Many municipal budgets separate tax-supported from fee-supported services and sometimes show only net figures – inflows minus outflows – for the latter. That practice drives another wedge between budgets and results and creates an obstacle for councillors, voters and others trying to compare plans and results.
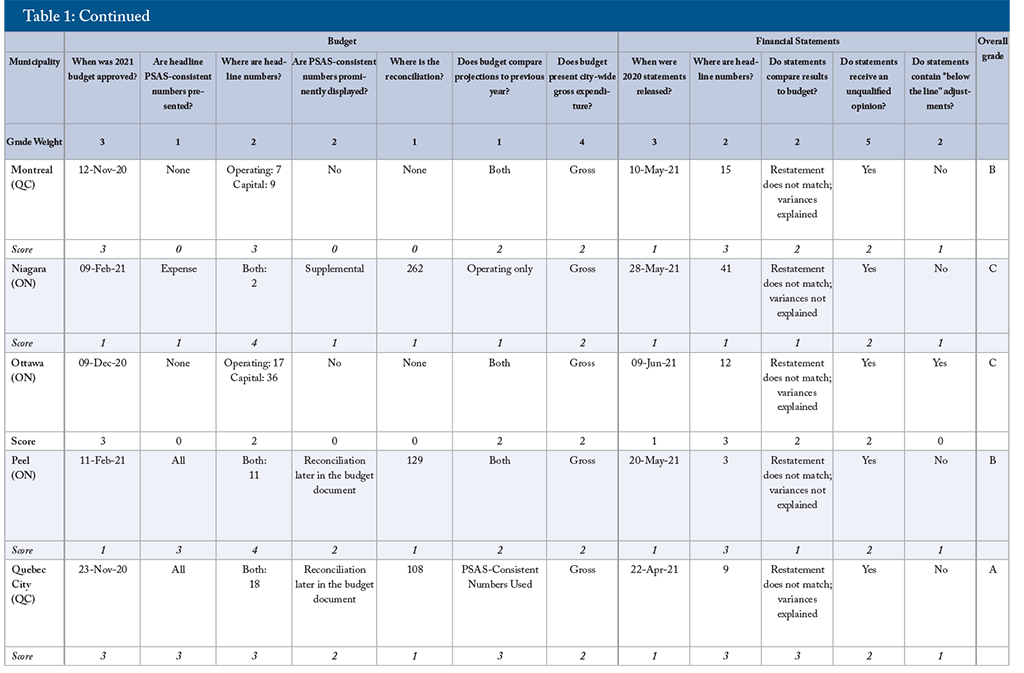
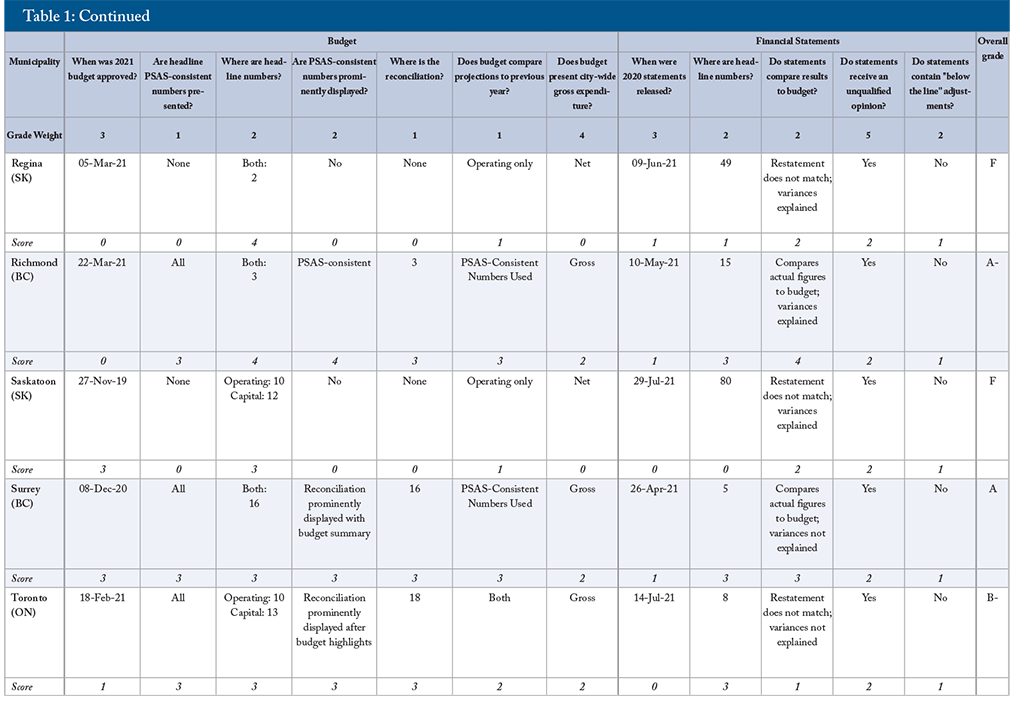
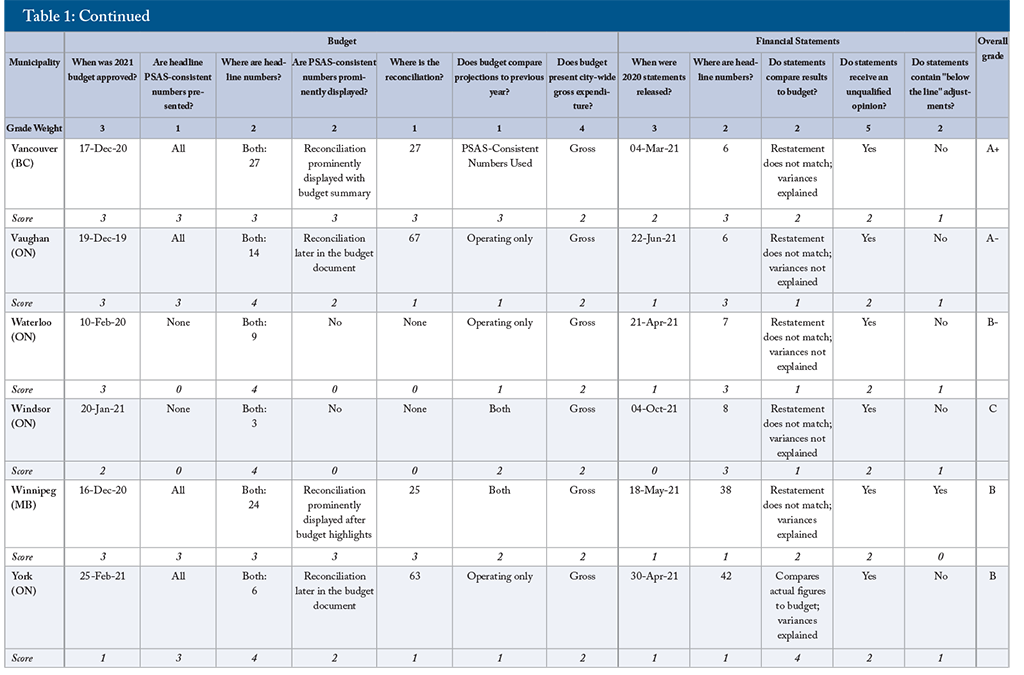
Rating Municipal Budgets and Financial Reports
The previous high-level discussion of users’ needs and existing practices sets us up for a detailed look at various aspects of municipal budgets and financial statements along with the criteria we use to grade them in our 2021 report card.
With the exception of Halifax, which has a fiscal year that runs from April 1 to March 31, our 31 municipalities have fiscal years that coincide with the calendar year: January 1 to December 31. Since spending without authorization by elected representatives violates a core principle of representative democracy, councillors clearly should vote on budgets before the beginning of the fiscal year. We awarded a top score of three if a municipality approved its budget before the fiscal year’s start,
Timely publication of financial statements helps councillors and others understand and react to deviations of results from plans. It also encourages faster gathering of the necessary information, which helps the budget process by providing more current estimates for the year about to end – a critical baseline for future plans. With the exception of Durham, which had not published its financial statements at the time of writing, we used the date of the auditor’s signature on the financial statements.
No user, expert or non-expert, should have to search through dozens of pages in a document or slides in a deck to find the key numbers for revenue, expense and surplus or deficit. Municipal financial statements usually present these numbers early and identify them clearly. However, many budgets do not. Our score regarding the placement of this vital information reflects where it appears. Closer to the document’s beginning is better, reducing the chance that a user will give up or encounter figures that appear to be the relevant figures but are not.
We looked through the most prominently displayed budget documents posted on a municipality’s website, stopping at the first aggregate figures identified as relevant totals. Where there was a choice between similar-looking documents displayed equally prominently – similar fonts and colours on clickable links, for example – we chose the first one in the list or menu.
We referenced the physical budget books and annual reports, or their electronic PDF equivalents, because web pages and links among documents are sometimes ephemeral and not clearly dated, presenting users with hard-to-quantify navigational challenges. We began counting at the first physical or electronic page.
We awarded a top score of three to municipalities that display consolidated revenues and expenses and the surplus or deficit – or, in the case of municipalities with separate operating and capital budgets, their operating and capital totals – within the first 15 pages of the budget document. We awarded a score of two to municipalities that present these numbers from 16 to 30 pages into the budget document, one to municipalities that present them from 31 to 50 pages in, and zero to municipalities that present them more than 50 pages in.
We also scored year-end results in annual reports, looking for a table that is clearly a summary statement of operations/transactions the same way. We did not scale our scores according to the overall length of the documents – by using percentages, for instance – because long documents are less user-friendly than short ones. Budgets and annual reports are easier to read and interpret if they are concise and to the point.
With respect to budgets, we awarded a bonus point to municipalities that presented operating and capital totals on the same page. Municipalities that presented their budgets on a PSAS basis, combining both operating and capital budgets into a consolidated total, naturally presented the full scope of activities on the same page, so they received the bonus mark. We also looked at the placement of any reconciliation between the budget totals and PSAS-consistent numbers, awarding a three to municipalities that presented the reconciliation within the first 30 pages of their budget documents, two to municipalities that present the reconciliations between 31 and 60 pages in, one to municipalities that present the reconciliation after the first 60 pages and zero to municipalities that do not present them at all.
Reliability and Transparency of Numbers
With respect to both budgets and annual reports, we asked if a reader could readily find consolidated revenues and expenses along with the projected surplus (or deficit)
As explained above, the situation with budgets is more complicated. We looked first at whether a municipality presented PSAS-consistent consolidated revenues, expenses and surpluses in its budget. We awarded one point for each. We then asked if the municipality displayed PSAS-consistent figures prominently in its budget highlights. We awarded a score of four to municipalities that presented the PSAS-consistent numbers as their primary exhibits. We awarded three to municipalities that presented their budget numbers differently but prominently presented a reconciliation within the budget summary or highlights. We awarded two to municipalities that provided a reconciliation later in the budget document. We awarded one to municipalities that provided a reconciliation as supplemental information, such as an appendix. We awarded zero to municipalities that used different accounting and provided no reconciliation.
Because many municipalities do not present PSAS-consistent figures in their budgets, we have an additional criterion: whether a municipality presented gross expenditures – both tax- and rate-supported – to give users a better view of the budget’s projected total claim on community resources for operating spending. We awarded two to municipalities that presented gross expenditures as their unique headline measure, one to municipalities that presented net and gross expenditures equally prominently and zero to municipalities that presented only net expenditures in their headline numbers, did not consolidate rate- and tax-supported expenditures and/or otherwise omitted government-controlled entities.
Financial results are easier to understand if the difference between revenues and expenses – the surplus or deficit – is straightforwardly related to the change in the city’s net worth over the fiscal year. Often it is not: a line with a label such as “other capital contributions” or “other comprehensive income or loss” may sit between the surplus or deficit for the year and the change in the accumulated surplus. While PSAS allow or even mandate such adjustments under certain circumstances, such as reporting gains and losses of municipally owned enterprises, there are reasons to dislike them.
For non-experts, “below-the-line” adjustments are problematically opaque. The accumulated surplus is the definitive statement of a city’s capacity to provide future services, and it is a problem if the results of the year’s operations imply something different than what actually occurred. Moreover, a government may not reliably honour the principle that such adjustments should relate to matters it could not have anticipated at budget time – for example, omitting an expense in one year to produce a bigger surplus for that year and reporting that expense in a later year as a reconciliation item that most users will likely ignore.
Because below-the-line adjustments are an obstacle to transparency and accountability, we included a criterion that notes whether a municipality had such an adjustment. We awarded a one to municipalities without an adjustment and zero to those with one.
Comparisons between Projections and Results
A useful budget should show projections for the coming year along with final results for the year before and expected results for the current year – the year about to end. That kind of presentation lets users see whether their municipality expects revenue and expenses to rise or fall, and by how much. It is standard in the budget presentations of Canada’s senior governments.
Unfortunately, none of the 31 cities we look at produced a budget comparing its projections to the anticipated results for the current year using PSAS-consistent numbers. The prevailing practice is to compare the budget to the previous year’s budget, and our scoring scheme reflects that inadequate situation. We awarded three to municipalities that provided a comparison of the budget to the previous year’s budget using PSAS-consistent numbers. We awarded two to municipalities that presented comparisons to the previous year’s budget for operating and capital spending, one to municipalities that did so for operating spending only and zero to municipalities that provided no budget comparison.
For their part, financial statements are more useful if they show and explain differences between results and budget plans. Because most municipalities do not present PSAS-consistent budgets, our scoring on this criterion reflects both the availability of any such comparison and the consistency of the accounting that underlies it.
We awarded a score of three to municipalities whose financial statements compared results to budget projections when the budget projections’ numbers in the financial statements matched those that appeared in the budget itself. We awarded two when financial statements compared results to budget projections when the budget projection numbers in the statements differed from those in the budget, but the statements reconciled them with the numbers that appeared in the budget. We awarded one when financial statements compared results to projections that did not match the numbers in the budget with no reconciliation. We awarded zero if the financial statements did not compare results to budget projections. We awarded a bonus point for statements that provided a budget comparison and accompanied it with explanations for variances of results from projections.
The 2021 Report Card on Canada’s Major Municipalities
We are now in a position to construct a report card for Canada’s major cities, based on their most recent (2021) round of budgets and most recent (2020) rounds of financial statements. We looked at the 25 largest cities by population plus the six most populous regional municipalities in Ontario.
We derived our letter grades for each city by standardizing the score on each criterion to be between zero and one. For example, a score of one in a criterion with a maximum score of two would yield a standardized score of 0.5. We weighted each criterion based on our judgments of relative importance to the overall goals of clarity, reliability and timeliness. We then summed the standardized, weighted scores to produce a percentage, which we converted to a letter grade. Municipalities received an A+ if they scored 90 percent or more, A for 85 percent to 89 percent, A– for 80 percent to 84 percent, B+ for 77 percent to 79 percent, B for 73 percent to 76 percent, B– for 70 percent to 72 percent, C+ for 67 percent to 69 percent, C for 63 percent to 66 percent, C– for 60 percent to 62 percent, D+ for 57 percent to 59 percent, D for 53 percent to 56 percent, D– for 50 percent to 52 percent and F for less than 50 percent.
The Best and Worst for Financial Reporting
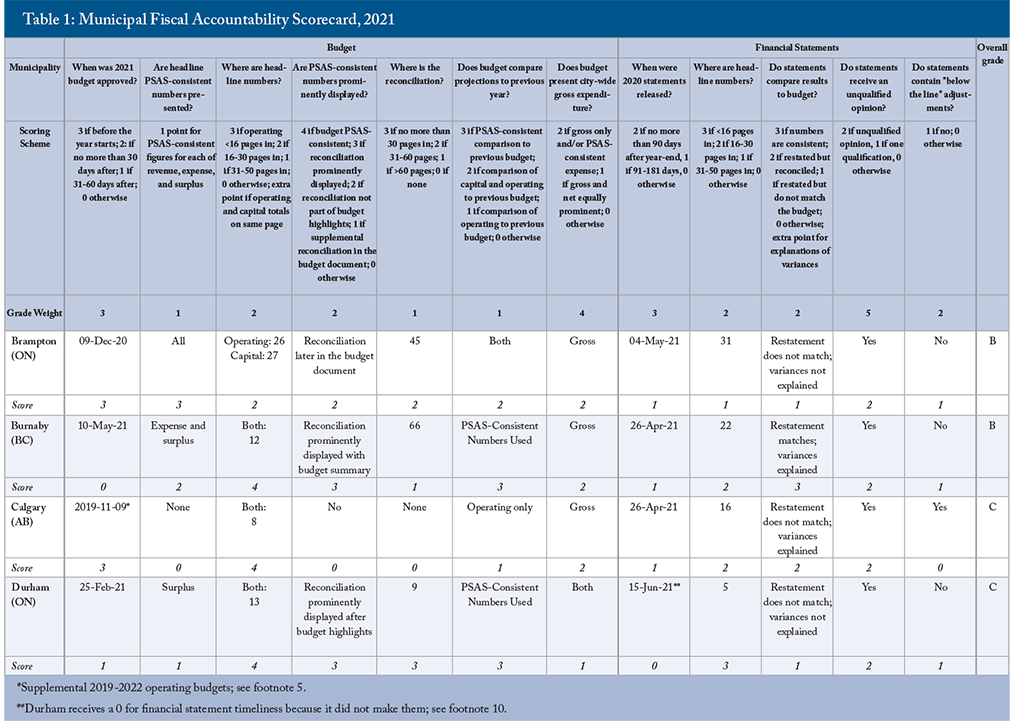
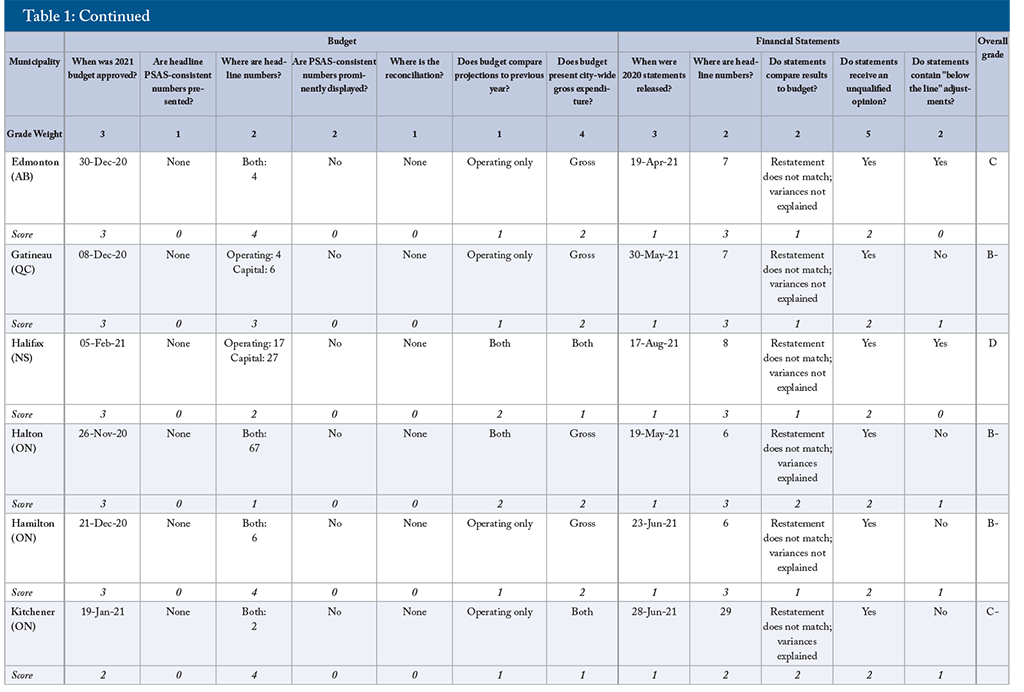
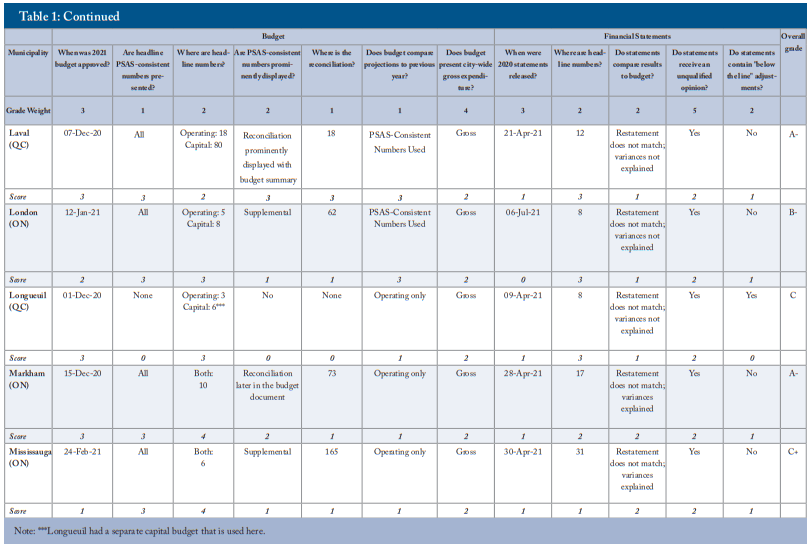
The results are mixed. Some standouts are in the A-range, two cities earn Fs and a large number have middling grades (Table 1). The large number of grades below B mainly reflects problems with budgets, notably the failure of most cities to show PSAS-consistent revenues, expenses and surpluses.
Results in Table 1: Evaluating the Financial Reporting of Canada’s Major Cities
The best performer, garnering a grade of A+, is Vancouver. Vancouver approved its 2021 budget before the start of the fiscal year, and published its 2020 financial statements within 120 days of year-end. Its budget presented projected expenses near the front of the document and provided budget information on a PSAS basis that was clear and came right after the initial budget presentation. Next are Surrey and Quebec City, each with an A. Both cities also approved their budgets and financial statements in a timely way, but Quebec City’s budget information was less complete and up front than was the case for Vancouver, while Surrey did not explain the variance between its budget and financial statements. Rounding out the A-range are Markham, Richmond, Vaughan and Laval, each with an A-. Markham and Vaughan, like the top performers, approved their 2021 budgets before the start of the fiscal year, and all four published their 2020 financial statements within 181 days of year-end. Richmond reported its consolidated totals on the same accounting basis as its financial statements, with non-PSAS adjustments appearing later in the document. Laval's early and prominent presentation of PSAS-consistent figures in its 2021 budget placed them near the front of the class.
Six cities garnered Bs. Burnaby, Peel and York fell short of top marks because their budgets and annual reports were less timely, while Brampton did not present key figures as early in its documents. Montreal did not present reconciliations to PSAS in its budget, while Winnipeg’s financial results were many pages deep in its annual report.
At the opposite end of the scale, with grades of F, were Regina and Saskatoon. Regina presented a budget that was late and confusing, and its financial statements compared results to numbers that did not match those in its budget. Saskatoon’s budget provided no PSAS-consistent numbers and highlighted net operating spending, while its financial statements, which were late, buried the headline numbers and reconciled them to numbers that did not match those in its budget.
Weights in this kind of grading inevitably reflect judgments about which reasonable people may differ. A simple test of the sensitivity of our 2021 grades to the weights we chose is to compare those grades to the grades that would have resulted from equal weights for each criterion. That exercise produces an average absolute change across the 31 municipalities of one degree – equal, for example, to a change from a B to a B-. The correlation between the rankings using weighted and non-weighted criteria is 87 percent, while the correlation between the numerical grades using weighted and non-weighted criteria is 91 percent.
Notwithstanding the lacklustre overall impression left by Table 1, improvements have occurred over the period the C.D. Howe Institute has been publishing its report cards on municipal fiscal transparency. Particularly notable is the prevailing adherence to PSAS in financial statements and the gradual appearance of more PSAS-consistent presentations in budgets, which has led to better comparisons of projections with results and vice versa.
Largely because of this improvement, we made changes from the scoring system we used in previous iterations of this report card. In the past, the almost universal practice of presenting budgets using cash accounting and separating operating and capital led us to focus on expenses only – the flows of money in and out of reserves making the revenue side of budgets all but impossible to follow – and highlight the prominent display of those numbers, regardless of whether they were PSAS-consistent. This year, we used the criterion of conformity with PSAS in budgets more generally, assessing comparability of revenue and spending categories under a separate heading.
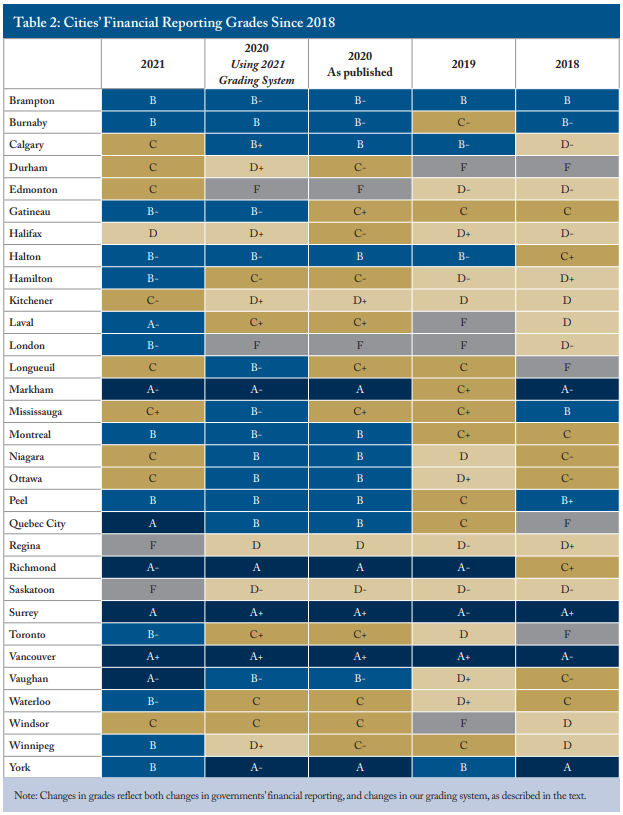
Table 2 provides another test of the sensitivity of our grades to the criteria and the weights by showing both the grade we awarded each municipality in last year’s version of this report and the grade we would have awarded it if we had used this year’s criteria and weights.
Comparing the 2021 grades to the 2020 grades that would have resulted from applying the current scheme, we see marked improvements for Edmonton, Hamilton, Quebec City, Waterloo and Winnipeg. Edmonton improved from an F, thanks to earlier and clearer budgets and timelier financial statements. Hamilton passed a timely budget in 2021. Quebec City improved its presentation by including a PSAS reconciliation in its 2021 budget, Waterloo produced both its budget and financial statements earlier, and Winnipeg passed a timelier budget. We also note London’s inclusion of PSAS-consistent figures in its 2021 budget, which raised it from the bottom rank.
Does the Quality of Municipal Financial Reporting Matter?
Relevant, accurate and accessible financial reports cannot, on their own, ensure that city governments will serve the interests of their citizens. They are an essential foundation, however: good numbers give citizens and legislators a strong start in understanding any problems the numbers reveal and in monitoring progress toward solutions.
A key problem with budgets that do not reconcile with financial statements is that people cannot evaluate budget plans relative to past results. Instead of operating with up-to-date information, most municipal councils develop their budgets with reference to past budgets – a practice that councillors and officials with experience outside municipal government readily acknowledge makes little sense. It is obvious that budgeting with reference to actual and anticipated results would be better.
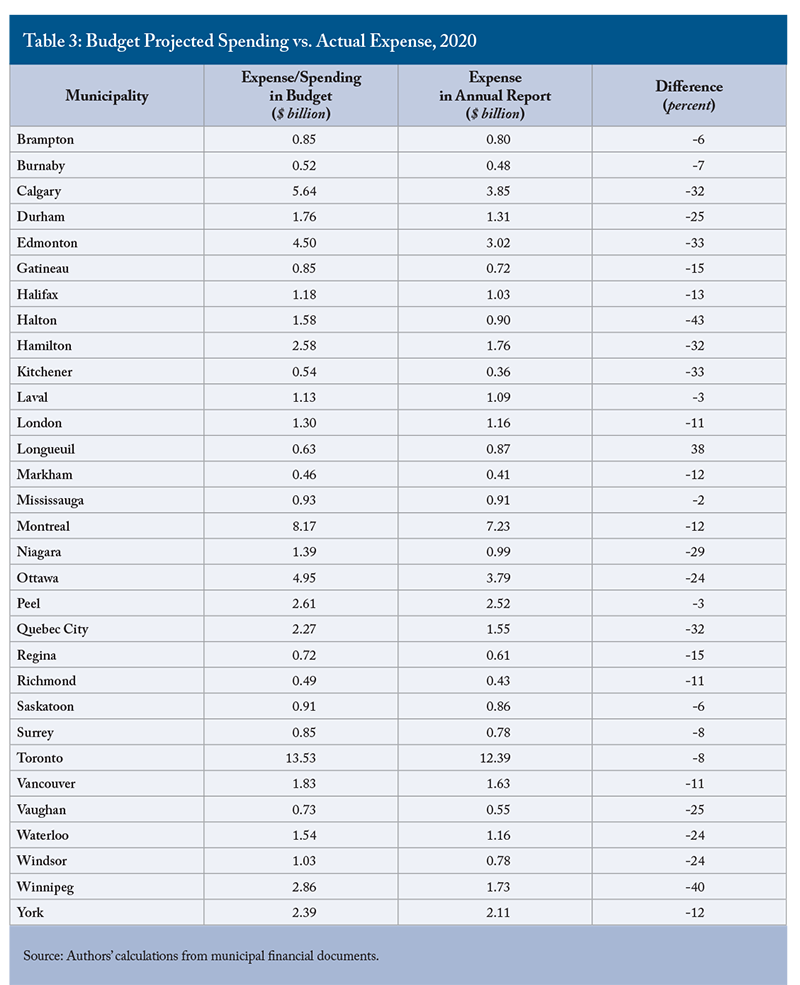
Moreover, inability to compare intentions and results reduces the attention councillors, the media and the public pay to municipal budgets. Why struggle with something that is hard to understand in the first place, if experience shows that you will not be able to compare it to the outcome? Consider what would happen if a diligent but non-expert councillor delved into his or her municipality’s operating and capital budgets and did what a motivated but naïve person might do to calculate spending: add the operating and capital totals together.
The numbers this approach would have yielded during the 2020 municipal budget round appear in Table 3 where we compare them with the expenses reported in each city’s 2020 financial statements. For example, Regina’s 2020 budget projected $725 million in spending. Its 2020 financial statements showed $614 million in actual expenses. This 15-percent gap is large enough that an expert with time to spare might suspect an accounting discrepancy and start to read the fine print – but a non-expert, struggling with financial reporting that we think merits a grade of F, might think the city’s financial management is simply inept. Many other municipalities had discrepancies between their 2020 budgets and results that would lead a councillor to conclude that the city’s execution was widely off: in almost one-third of our cities, the gap a numerate but non-expert reader would calculate was 25 percent or more.
The differences in Table 3 might reflect, in part, municipalities’ over- or underspending relative to their budget commitments. What is certain is that some of the biggest reflect inconsistent accounting. Municipalities that present PSAS-consistent budgets or very prominent PSAS reconciliations still experience gaps between beginning-of-year intentions and year-end results: even well-managed businesses, households, not-for-profits and governments do not hit their budget targets exactly. But gaps for those municipalities presenting PSAS-consistent budgets tend to be smaller.
Not only do such large discrepancies create a risk of disengagement – readers might conclude that the projections are meaningless or municipal finances are out of control – they create more particular problems. The apparent high price tag on capital projects in municipal budgets likely discourages capital investments and encourages cities to charge too much up front for the projects they undertake. As a result, many cities accumulate significant deferred revenue, or reserves, holding financial assets in respect of capital projects that are not yet built and may never be built.
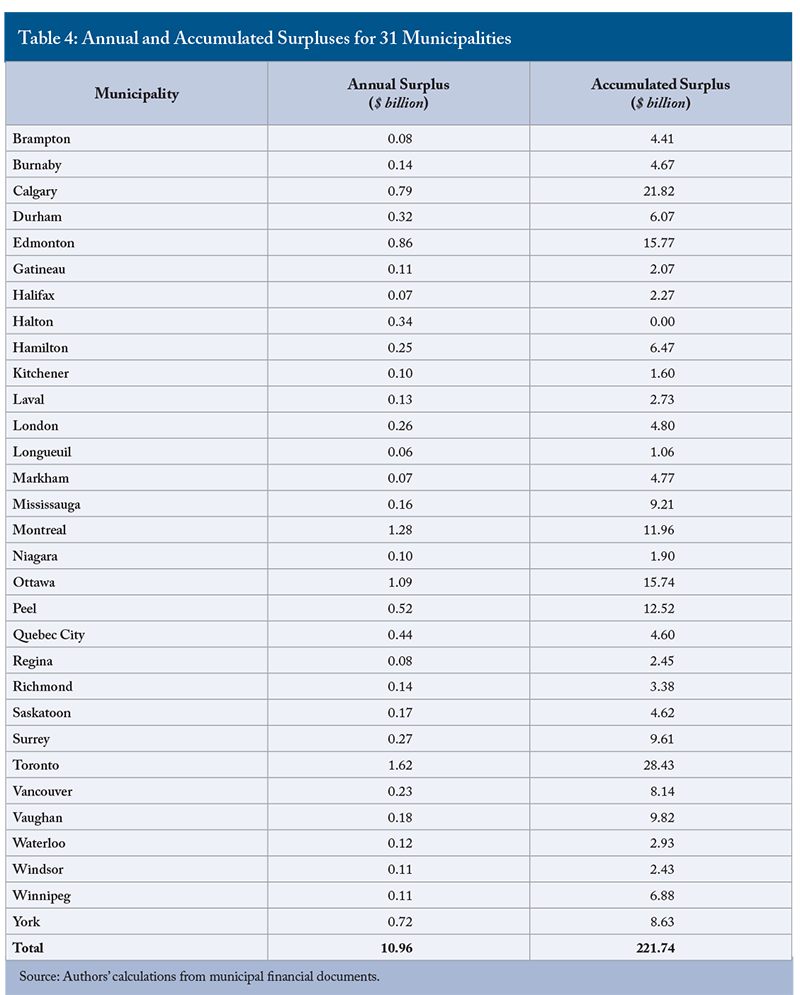
A related point is that while annual angst over balancing the city’s budget is familiar to councillors, ratepayers and voters, the sizable annual surpluses cities show in their financial statements get much less notice. The 31 municipalities in this survey had surpluses totaling almost $11 billion in 2020 and accumulated net worth of $221 billion (Table 4). Cities are in better financial shape than most of their citizens think and might be quicker to invest in needed infrastructure if confidence in their condition, and ability to deliver services, were higher.
With the debts of senior Canadian governments generally ballooning, it is good news that one level of government has positive net worth. Cities have large stocks of productive capital. Many cities also have large stocks of financial assets, however (Robson and Wu, 2021b). In those cases, concerns about the unaffordability of infrastructure investments may be off the mark. One way or another, budget rhetoric and fiscal reality are often out of sync.
The Power of Financial Documents to Affect Decisions
Disagreements between governments and auditors or other outside observers over financial presentations offer indirect but powerful testimony of their importance. Battles between senior governments and legislative auditors show that governments think the presentation of financial information matters: why risk a qualified opinion unless the presentation of misleading numbers offers some political reward?
At the municipal level, the persistence of cash accounting in budgets testifies to more than just inertia: advocates of cash accounting and balanced operating budgets expect the presentations they prefer to produce different outcomes than budgets prepared in accordance with PSAS. Commenting on past versions of the C.D. Howe Institute’s annual report card, some municipal officials have said that their budget presentations blunt pressures to spend and borrow. But shaping a budget presentation to produce a desired outcome is problematic in principle, and can distort decisions in unexpected ways.
In view of the current high level of concern in Canada about housing affordability, one particular problematic money-raising measure practised by some municipalities is worth highlighting: infrastructure charges imposed on developers. These charges, which are a key financing mechanism for municipal capital assets, can be as high as $80,000 for a single-family house in the Greater Toronto Area, between $30,000 and $35,000 in cities such as Hamilton and Surrey and more than $20,000 in Calgary (Dachis 2018). Water and other infrastructure provide benefits over a wider geography, and over a longer period, than is relevant to the average homebuyer in the present. To the extent that cash budgeting encourages upfront financing, it makes new homes less affordable.
Getting Better from Here
Municipal fiscal accountability will be better when a smart and motivated, but non-expert, councillor or taxpayer can pick up a municipality’s budget and financial statements for a given year, start at page 1, and find the consolidated revenue and expense figures early and easily. Ideally, this reader will also be able readily to compare budget projections to past experience and the results in the financial statements to the budget for that year. Moreover, the information should be timely enough to inform budget decisions and votes. The budgets and financial statements of most Canadian senior governments – which have not consistently met this standard in the past – now make this exercise possible (Robson and Wu 2021a). Several steps could bring Canada’s municipalities up to the same mark.
Adopt PSAS-Consistent Accounting in Budgets
A key start is for municipalities to prepare and present their budgets using the same PSAS-consistent accounting they use in their financial statements. This change would make the numbers in the two documents directly comparable – a big step forward in transparency. It would bring municipal capital budgeting into the modern era, expensing long-lived assets as they deliver their services and wear out, rather than showing them as massive cash outlays up front and ignoring them afterwards. It would also provide budget readers with the same consolidated measures of revenues and expenses – and the more meaningful surpluses – that they get with financial statements, including all entities that the municipal government controls and that depend on it for financing.
Today’s approach to municipal budgets has roots in the distant past when modern accrual accounting did not exist and cash was a natural focus. A century ago, governments were smaller, and legislators could oversee individual transactions that are trivial by today’s standards. Liquidity – a government’s ability to cover payroll and make its interest payments on time – used to be a more prominent concern than it is with modern governments, which have greater capacity to tax and borrow.
PSAS evolved in the 1980s, introducing accrual accounting and taking a more comprehensive approach to the reporting entity’s service capacity – for example, by considering non-financial assets, such as buildings and infrastructure, alongside financial assets, such as bank deposits, and considering liabilities, such as pension promises and environmental cleanup, alongside market debt. Canada’s senior governments, with their greater legislative autonomy, have gradually – and not without setbacks – adopted PSAS, first in their financial statements and later in their budgets.
Although some municipal officials maintain, for example, that cash budgeting for capital is easier for councillors to understand, and that separate presentations of tax- and rate-supported services is more meaningful for citizens, these objections do not preclude putting PSAS-consistent numbers front and centre. Even cities that do not present PSAS-consistent budgets have noted the superiority of the PSAS framework. Toronto’s 2021 budget stated that complying with PSAS and producing an accrual budget “provides more information as to whether the government entity… is in a better or worse position than the previous year (City of Toronto 2021, p.18).” Similarly, in its 2021 budget, Brampton noted that “full accrual budgeting provides stakeholders with a better reflection of the long-term financial health of the municipality for decision-making purposes (City of Brampton 2021, p.45).” We agree with these statements: accrual budgeting matches revenues and expenses better than cash budgeting does, and is thus better suited to matching costs and benefits to taxpayers and citizens over time. We look forward to all municipal budgets reflecting the superiority of the PSAS framework.
One barrier to PSAS-consistent budgets in many cities is provincial regulations. Some provinces, such as Alberta, require their municipalities to have separate operating and capital budgets. Others, such as Ontario, require their municipalities to balance their operating budgets, including transfers to and from reserves. And others, such as BC, require their municipalities to include debt principal repayments in their spending. This is odd on its face since most provinces adhere to PSAS in their own budgets. None objects to PSAS in municipal financial statements – indeed, Quebec mandates that its municipalities provide PSAS-consistent versions of their budgets to the province.
While these provisions discourage municipalities from providing PSAS-consistent numbers in their budget documents, they do not prevent it. Notwithstanding BC’s regulations, Richmond produces a budget that matches its financial statements, and Vancouver and Surrey produce reconciliations of budgets to PSAS-consistent statements that are immediate, straightforward and easy to understand. All cities can, and should, do likewise. The introductions by mayors and city managers in the opening pages of a typical municipal budget are excellent places to present PSAS-consistent summaries of the budget’s revenues, expenses and expected surplus.
Although PSAS prescribe a single figure for consolidated revenues, and for consolidated expenses, and an annual surplus or deficit that reflects the difference between the two, municipal budgets commonly separate the costs of fee- and tax-supported services. Consolidated figures are superior measures of the activity under the government’s control: they provide a more complete picture of a city’s operations and their implications for its capacity to deliver future services. Not coincidentally, they correspond to the figures in the financial statements. Nothing in the presentation of consolidated figures restricts a city’s ability to adjust rates and property taxes: it simply provides a better comprehensive picture.
Nothing stops municipal governments from providing further additional information, including the breakdown between costs that households can control – by using less water, for example, or smaller garbage bins – and taxes that they cannot. But that and other details should not distract readers from the PSAS-consistent numbers.
With respect to municipalities’ bottom lines, provinces that wish to constrain their municipalities could change their requirement for balanced operating budgets to refer to the surplus calculated according to PSAS and the resulting change in the municipality’s accumulated surplus. These are familiar figures at the senior-government level and would give users vital information in a widely understood format.
Limit Below-the-Line Adjustments
Whatever the justifications for entries that drive a wedge between the annual surplus or deficit and the change in the accumulated surplus over the year, they are obstacles to accountability. Budgets do not anticipate them, and most users pay little or no attention to them.
If ownership of a utility or other investments is affecting a municipality’s capacity to deliver services, independently of the decisions of councillors or the actions of officials, an opaque adjustment below the formal surplus for the year is not conducive to a sensible conversation. Particularly if the impact is negative, people should talk about dealing with it, or perhaps disposing of a liability.
Present Key Figures Early and Unambiguously
No one, expert or otherwise, should have to dig through dozens or even hundreds of pages of a document or slide deck to find consolidated revenues, expenses and the surplus or deficit. Nor should this person come across more than one candidate for each total and wonder which is correct. The summary in Table 1 understates the obstacle that obscure and fragmented presentations can create for would-be users of municipal budget documents. We invite readers to check the budget documents produced by their own municipalities. Too often, the search will involve multiple hyperlinks, reams of pages and many numbers that a non-expert might think are the right ones, but are not.
Early and unambiguous presentation is easy. Among senior governments, Yukon presented the key consolidated figures on page 8 of its 2021 budget and on page 10 of its 2020/21 public accounts. Municipalities should follow that example. Vancouver’s 2020 annual report shows its year-end results on page 6. Prominent display of the key numbers helps municipalities explain their content and importance to councillors, the media and taxpayers.
Show and Explain Variances between Results and Projections
Municipalities should reconcile their year-end results with their budget projections, using common accounting methods, consistent numbers and informative commentary. We also encourage municipalities to follow the valuable practice of the federal and many provincial and territorial governments: publishing in-year reports that, using PSAS-consistent accounting, compare interim results to plans.
Publish Timely Budgets and Financial Statements
Prompt presentation of budgets and timely publishing of financial statements are key elements in accountability. Councillors should approve spending before it occurs and should have timely information on the year under way when they start their discussions of the next year’s budget. Municipalities that use a calendar year for financial purposes should vote on their budgets well before January 1 and publish their financial statements before April 30. Some provinces that impede timely presentations should stop.
Conclusion: Let’s Have Better Municipal Fiscal Accountability
Canada’s cities are central to the lives of most Canadians and absorb commensurately large shares of Canadians’ incomes. City councillors, taxpayers and voters need clear information about their finances if they are to hold officials and elected representatives to account for the quality and cost of municipal services. Cities will be under financial stress in the post-COVID era, elevating the importance of good understanding of, and intelligent debate about, municipal finances.
The budgeting practices of most major Canadian municipalities are not up to the mark. Municipalities should present budgets that are consistent with PSAS and that readers can compare easily with their subsequent financial statements. Municipalities should produce information that is more accessible and timelier. Before Canadians grant their cities more taxing powers or increase the support they receive from senior governments, they should insist on better transparency and accountability for cities’ use of public funds. The recommendations in this Commentary would help raise the financial management and fiscal accountability of Canada’s municipalities to levels more in line with their importance in Canadians’ lives.
References
City of Brampton. 2020. Budget. December.
City of Toronto. 2021. Budget. February.
Dachis, Benjamin. 2018. “Hosing Homebuyers: Why Cities Should Not Pay for Water and Wastewater Infrastructure with Development Charges.” E-Brief. Toronto: C.D. Howe Institute. August.
Dachis, Benjamin, and William B.P. Robson. 2011. “Holding Canada’s Cities to Account: An Assessment of Municipal Fiscal Management.” Backgrounder 145. Toronto: C.D. Howe Institute. November.
International Budget Partnership. 2020. “The Open Budget Survey, 2019.” Washington, DC. March.
OECD (Organisation for Economic Co-operation and Development). 2002. “OECD Best Practices for Budget Transparency.” Paris.
Ontario Securities Commission (OSC). 2021. “Filing Calendar 2021.” Available at: https://www.osc.ca/en/industry/companies/reporting-issuer-and-issuer-forms/filing-due-dates-calendar-annual-and-interim-filings-reporting-issuers.
Public Sector Accounting Board. 2018. “Statement of Concepts: A Revised Conceptual Framework for the Canadian Public Sector.” Toronto. May.
_____________. 2021. “Financial Statement Presentation, Proposed Section PS 1202.” Toronto. Exposure Draft. January.
Robson, William B.P., and Alexandre Laurin. 2018. Retiring Employees, Unretired Debt: The Surprising Hidden Cost of Federal Employee Pensions. Commentary 514. Toronto: C.D. Howe Institute. May.
Robson, William B.P. 2019. “Does Accounting Drive Budget Decisions? The Strange Case of the Toronto Subway ‘Upload’.” C.D. Howe Institute Intelligence Memo. September 20.
Robson, William B.P., and Miles Wu. 2021a. Good, Bad, and Incomplete: Grading the Fiscal Transparency of Canada’s Senior Governments, 2021. Commentary 607. Toronto: C.D. Howe Institute. September.
_____________. 2021b. Puzzling Plans and Surprise Surpluses: Canada’s Cities Need More Transparent Budgets. Commentary 592. Toronto: C.D. Howe Institute. February.